
This analysis reads network power demand from the Cambridge Bitcoin Electricity Consumption Index on 1 August 2026, alongside the live network hashrate on 31 July 2026 and the U.S. industrial electricity price of 8.85 cents per kWh published by the EIA on 23 July 2026. Fleet efficiency is derived from those figures rather than assumed, and facility overhead already sits inside the Cambridge estimate, so no further adjustment is applied on top. Emissions intensities come from the IEA and Ember Climate.
Bitcoin’s most recent halving in April 2024 reduced the block reward from 6.25 to 3.125 BTC, cutting miner payouts in half. But mining activity didn’t slow down. The network kept growing through 2025, reaching roughly 894.5 exahashes per second (EH/s) in July 2025 and peaking near 1,160 EH/s that October. As at 31 July 2026 it sits at approximately 878 EH/s, with mining difficulty at 126.23 trillion. The next halving is not due until around April 2028, so the 3.125 BTC reward has another two years to run.
That surge in hashrate means more machines are competing to secure fewer coins. The same infrastructure now consumes significantly more electricity to produce the same number of Bitcoins. As a result, the energy required to mine just one Bitcoin has nearly doubled since early 2024.
The breakdown below uses data verified on 31 July 2026: the live Bitcoin network hashrate, the Cambridge Bitcoin Electricity Consumption Index estimate of network power demand, and U.S. industrial electricity prices of 8.85 cents per kWh, the EIA rolling twelve-month figure to May 2026 released on 23 July 2026. Together these give the energy cost of mining one Bitcoin in the current post-halving landscape.
For a cross-check against real operators, CoinShares put the weighted average cash cost of mining one Bitcoin among listed miners at roughly USD 79,995 for Q4 2025, published 25 March 2026. That figure covers electricity and direct operating costs only. It excludes depreciation, SG&A and interest, so all-in costs run materially higher, and it reflects listed miners rather than the global network.
Miners typically pay well below the industrial average, so treat 8.85 cents as an upper bound rather than what a large operation actually pays.
How Much Energy Does It Take to Mine 1 Bitcoin in 2026?
To calculate the electricity required to mine a single Bitcoin in 2026, we start with the current state of the Bitcoin network. As at 31 July 2026 the network hashrate was approximately 878 EH/s, or 878,000,000 terahashes per second (TH/s), with difficulty at 126.23 trillion. Difficulty is the exact figure. Hashrate is an estimate derived from block times, and providers differ by a few percent.
Turning a hashrate into an electricity figure needs a fleet efficiency, and that is where most published estimates go wrong. Taking a number off a manufacturer spec sheet ignores the older machines that stay switched on wherever power is cheap enough to justify running them. So we start from the other end, with a published estimate of what the network actually draws.
The Cambridge Centre for Alternative Finance maintains the Cambridge Bitcoin Electricity Consumption Index, which models demand from the hardware likely to be running and includes facility overhead. Read on 1 August 2026, it gives:
Estimated network power demand: 16.09 GW Annualised consumption: 141.02 TWh Modelled range: 8.61 GW lower bound, 28.19 GW upper bound
Continuous draw at that level works out at:
16.09 GW × 24 hours = 386 GWh per day
Two things follow from starting here. Cooling, power conversion and site losses already sit inside the Cambridge estimate, so there is no separate overhead multiplier to apply on top. And fleet efficiency stops being an assumption and becomes something we can check: 16.09 GW spread across 878 EH/s implies about 18.3 J/TH network-wide. Current-generation hardware runs at 13 to 15 J/TH, so the gap is the older fleet still earning its keep on cheap power.
One Bitcoin now consumes more electricity than the entire nation of Iceland uses in 12 hours.
The protocol produces 450 new coins per day (144 blocks × 3.125 BTC). That gives the energy behind one Bitcoin:
386,160,000 kWh ÷ 450 = approximately 858,000 kWh per BTC
Cambridge’s bounds put the same figure somewhere between roughly 459,000 and 1,503,000 kWh. That spread matters more than the midpoint, because nobody meters the Bitcoin network. Every number on this page is a model output, and this one carries a range of about three to one. For comparison, the average U.S. home consumes about 10,500 kWh per year, according to the U.S. Energy Information Administration, April 2025, meaning that mining a single Bitcoin in 2026 uses as much electricity as 81.71 years of residential energy use.
Daily Bitcoin mining now uses more electricity than the entire country of Belgium over the same 24-hour period.
Pre- and Post-Halving Comparison
Before the April 2024 halving, miners received 6.25 BTC per block. At the time, the global network operated at an average hashrate of approximately 505 EH/s, and the estimated energy required to mine one Bitcoin was around 429,000 kilowatt-hours (kWh), holding network power demand at today’s level so the comparison isolates the halving rather than mixing it with hashrate growth.
Following the halving, the reward was reduced to 3.125 BTC per block. Daily issuance fell from 900 BTC to 450, so at the same network draw the energy behind each coin doubled, to approximately 858,000 kWh. Hashrate has kept climbing since, peaking near 1,160 EH/s in October 2025 and sitting at roughly 878 EH/s on 31 July 2026.
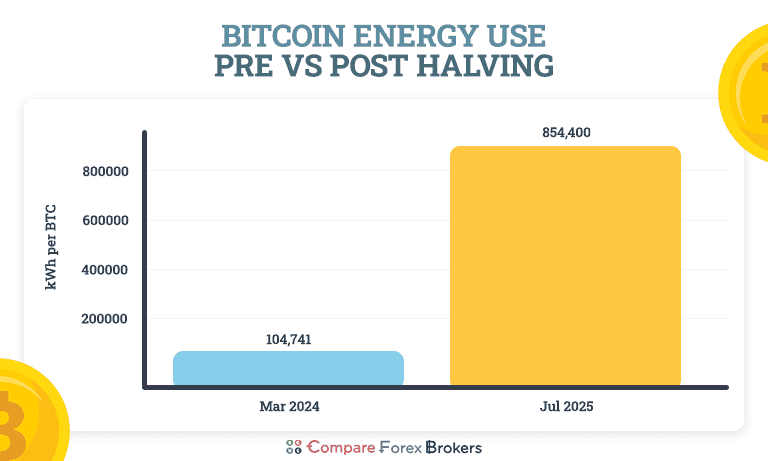
The total power draw of the Bitcoin network does not decrease when block rewards fall. Instead, the energy burden per coin increases, since the protocol maintains a consistent block production rate through automatic difficulty adjustments. This leads to higher costs per Bitcoin in both energy and monetary terms.
Electricity Required to Mine 1 BTC (Pre vs Post Halving)
| Period | Block Reward (BTC) | Daily Issuance (BTC) | Energy per BTC (kWh) |
|---|---|---|---|
| Before the April 2024 halving | 6.25 | 900 | ~429,000 |
| At 31 July 2026 | 3.125 | 450 | ~858,000 |
Sources:
- Network hashrate: mempool.space three-day average, 31 July 2026
- Fleet efficiency: derived from CBECI network power demand divided by network hashrate, not assumed
- Block reward history: BTC.com Block Explorer (accessed July 2025)
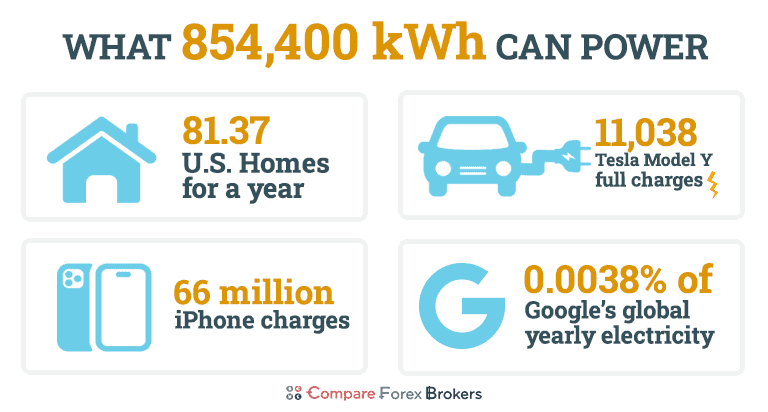
To make this figure more tangible, here are a few real-world equivalents:
- Charging a Tesla Model Y (77.4 kWh battery): 858,000 ÷ 77.4 = 11,085 full electric car charges
- Charging an iPhone 15 (12.95 Wh per charge): 858,000,000 Wh ÷ 12.95 = 66,254,826 iPhones charged
- Powering the average U.S. household (10,500 kWh/year): 858,000 ÷ 10,500 = 81.71 households for one year
One Bitcoin uses more electricity than 11,000 full Tesla charges.
The dramatic rise in power use per Bitcoin is a predictable outcome of the halving. But it has significant implications. Profit margins are shrinking. At the U.S. industrial average of 8.85 cents per kilowatt-hour, the electricity behind one Bitcoin runs to about $75,900, before hardware, staffing or financing. Operators either hold their power costs well under that average or they stop being viable.
Only the most cost-effective miners remain competitive, typically those with access to stranded or surplus power, vertically integrated energy infrastructure, or long-term power purchase agreements well below market rates. At the same time, the climate burden intensifies. Even in regions with partial renewable energy penetration, the absolute amount of electricity needed per coin has never been higher. For facilities still relying on fossil fuel grids, that translates into a direct increase in carbon emissions per unit mined.
This trend also carries systemic implications. The rising cost of participation is pushing smaller, retail-reliant operators out of the network. As these marginal players exit, mining becomes increasingly concentrated among large, institutional entities that benefit from scale, private energy access, or opaque financial backing. The result is a global shift toward higher-efficiency, lower-transparency zones of Bitcoin production.
The electricity to mine one Bitcoin could charge every iPhone in California, twice.
Power Demand and Mining Costs for Bitcoin in the US
The United States remains the dominant force in global Bitcoin mining. According to the most recent geographic distribution estimates from the Cambridge Centre for Alternative Finance, the U.S. accounts for approximately 37.9% of the global Bitcoin hashrate. On the 878 EH/s network measured on 31 July 2026, that puts the U.S. share at roughly 333 EH/s.
That’s equivalent to more than 13% of the entire U.S. commercial electricity use per day, based on April 2025 EIA estimates.
This makes the U.S. responsible for an estimated 170.55 BTC mined per day, out of the 450 BTC produced globally. Applying that share to the Cambridge network figure:
- U.S. hashrate: 333,000,000 TH/s, or 37.9% of 878 EH/s
- Share of network power: 16.09 GW × 37.9% = 6.10 GW
- kWh per hour: 6,100,000 kWh
- kWh per day: 6,100,000 × 24 = approximately 146 GWh
Facility overhead already sits inside the Cambridge estimate, so nothing further is added on top. This means U.S.-based Bitcoin mining consumes roughly 53,400 GWh per year, placing it among the most electricity-intensive digital sectors in the country.
Enough energy each day to boil 1.9 trillion cups of coffee.
The Cost of Mining in the USA
Mining is an industrial electricity load, so the industrial series is the right one to price it with. The U.S. Energy Information Administration puts the average U.S. industrial rate at 8.85 cents per kilowatt-hour over the rolling twelve months to May 2026, released on 23 July 2026. Applied to the 858,000 kWh behind each coin:
858,000 kWh × $0.0885 = $75,933 per Bitcoin
Across the roughly 170.55 coins mined in the U.S. each day, that is:
$75,933 × 170.55 = approximately $12.95 million per day
This is the electricity bill on its own. It excludes hardware, staffing, financing and site costs, so treat it as a floor rather than a cost of production. It is also an upper bound on the electricity component, because operations at this scale negotiate power well below the industrial average, which is what the lower rates in the table below are there to show.
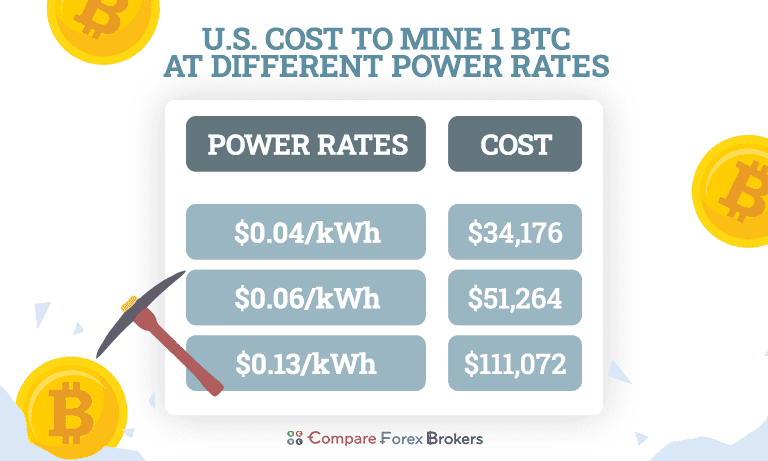
Estimated Cost to Mine 1 BTC at Different U.S. Electricity Rates
| Power Price ($/kWh) | Daily Cost (US Network) | Cost per BTC (USD) |
|---|---|---|
| $0.0885 (EIA industrial average) | $12,950,373 | $75,933 |
| $0.06 (low end) | $8,779,914 | $51,480 |
| $0.04 (ultra low) | $5,853,276 | $34,320 |
Sources:
- Electricity pricing: U.S. Energy Information Administration industrial rate, rolling twelve months to May 2026, released 23 July 2026
- Mining power demand: 37.9% of the CBECI network estimate, about 146 GWh per day
- Bitcoin mined per day: Cambridge Bitcoin Electricity Consumption Index (CBECI), read 1 August 2026
Can USA Miners Stay Profitable?
A spot price check goes stale within days, so the durable number here is the threshold rather than the verdict. Electricity alone sets a floor under the cost of a coin, and that floor moves with the power price an operation has negotiated:
- 8.85 cents per kWh, the U.S. industrial average: Bitcoin has to clear $75,933 to cover electricity
- 6 cents per kWh: $51,480
- 4 cents per kWh: $34,320
Turned around, that gives one figure worth tracking. Divide the Bitcoin price by 858,000 kWh and you get the highest power price at which the electricity still pays for itself. On 31 July 2026, with Bitcoin near $63,000, that comes out at roughly 7.3 cents per kilowatt-hour.
The U.S. industrial average is 8.85 cents. An operation buying power at that average does not currently cover its electricity, never mind its hardware, and the CoinShares cash-cost benchmark of $79,995 per coin sits above the Bitcoin price as well. Large-scale miners do not buy power at retail, and this is why.
Instead, U.S. miners gain competitive advantage through:
- Vertical integration: Many operate proprietary renewable facilities or purchase surplus hydro/solar power at sub-grid pricing (Cambridge Centre for Alternative Finance, 2024; Hashrate Index, 2025).
- Strategic location: States like Texas, Georgia, and North Dakota offer access to behind-the-meter industrial energy markets, with rates often below $0.05/kWh (ERCOT Grid Data, 2025).
- Grid participation: Demand response programs allow flexible miners to monetize idle capacity by selling electricity back to the grid or being compensated for curtailing use during peak hours (DOE Demand Response Survey, 2024).
With these mechanisms the electricity behind one coin costs $34,320 to $51,480 at $0.04 to $0.06 per kWh, against $75,933 at the industrial average. That gap is the business. Whether it leaves a margin depends on where Bitcoin trades on the day, which is why the breakeven power price above is the more useful figure to watch.
Bitcoin vs USA Power Use
U.S. Bitcoin mining consumes roughly 53,400 GWh of electricity a year, on a daily footprint of about 146 GWh. That is enough energy to support approximately 740.6 million full charges of electric vehicles, assuming an average battery capacity of 72.1 kWh, according to the IEA Global EV Outlook 2025.
This represents roughly 30% of the total electricity used by the global EV fleet in 2024.
USA Bitcoin mining uses more electricity than every electric vehicle on Earth consumes in a typical year.
Policy Risks and Sustainability Pressures
This level of energy consumption has drawn attention from U.S. regulators. The Department of Energy’s revived EIA Form 861M survey now explicitly collects monthly data on crypto mining electricity load, following grid stability concerns in Texas during extreme weather events.
There are ongoing policy proposals to:
- Require energy transparency from large-scale crypto operations
- Add fees for miners during peak demand periods
- Limit access to grid-based subsidies for high-consumption loads
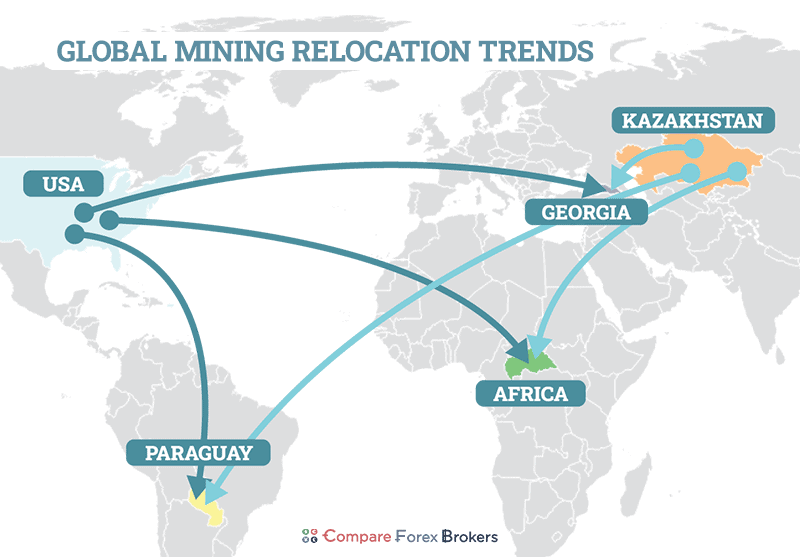
If electricity prices continue to rise, or if new taxes on crypto mining are introduced, many U.S.-based miners may become uncompetitive compared to operations in Kazakhstan, Paraguay, or hydro-rich African nations, where energy is both cheaper and less regulated.
Where Bitcoin Mining Consumes the Most Electricity in 2026
Bitcoin’s energy footprint is no longer a fringe topic. In 2026, its total electricity demand rivals that of entire nations, with a few countries responsible for most of the global load.
The Global Hashrate Picture
With the network at roughly 878 EH/s on 31 July 2026 and a fixed reward of 3.125 BTC per block, the protocol produces 144 blocks and 450 new BTC a day. Cambridge puts the electricity behind that at:
- Network power demand: 16.09 GW estimated, within a modeled range of 8.61 to 28.19 GW
- Daily consumption: 16.09 GW × 24 = approximately 386 GWh
- Annualised consumption: 141.02 TWh
- Implied fleet efficiency: approximately 18.3 J/TH across 878 EH/s
This means mining one Bitcoin now requires:
386,160,000 kWh ÷ 450 BTC = approximately 858,000 kWh per BTC
That is equivalent to powering 81.71 average U.S. households for an entire year.
Bitcoin mining now consumes more electricity in a single day than the entire city of San Francisco.
Power Use by Country
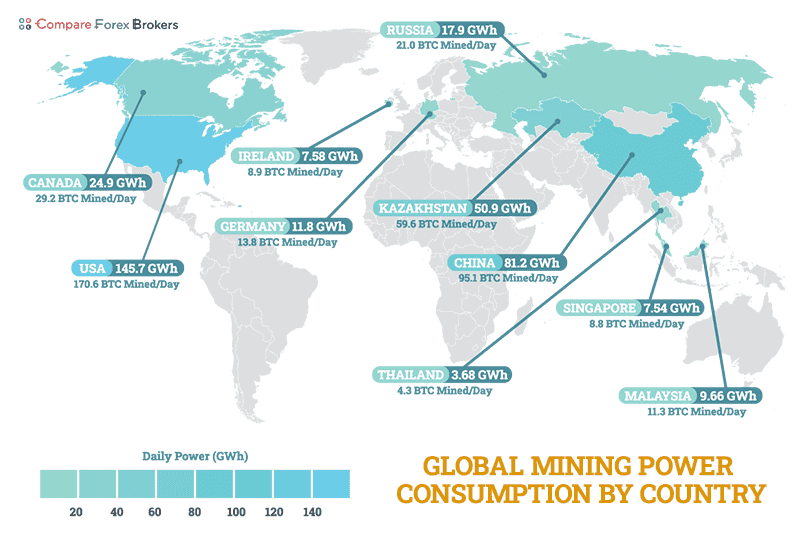
Using updated geographic hashrate distribution data from Cambridge’s CBECI for mid-2025, here’s the top 10 breakdown of Bitcoin mining power consumption by country:
| Country | Daily Power (GWh) | Annual Power (GWh) | BTC Mined/Day | Share of Global Power |
|---|---|---|---|---|
| USA | 145.7 | 53,200 | 170.6 | 37.9% |
| China | 81.2 | 29,600 | 95.1 | 21.1% |
| Kazakhstan | 50.9 | 18,572 | 59.6 | 13.2% |
| Canada | 24.9 | 9,096 | 29.2 | 6.5% |
| Russia | 17.9 | 6,549 | 21.0 | 4.6% |
| Germany | 11.8 | 4,301 | 13.8 | 3.1% |
| Malaysia | 9.66 | 3,526 | 11.3 | 2.5% |
| Ireland | 7.58 | 2,767 | 8.9 | 2.0% |
| Singapore | 7.54 | 2,753 | 8.8 | 2.0% |
| Thailand | 3.68 | 1,344 | 4.3 | 1.0% |
Sources
- Global mining assumptions and efficiency: Energy and AI: Updated Assumptions for Global Mining Efficiency, 2025
- Country hashrate distribution: Cambridge Bitcoin Electricity Consumption Index (CBECI), read 1 August 2026
- Issuance: Bitcoin protocol, 144 blocks per day at 3.125 BTC
According to CBECI, the U.S., China and Kazakhstan together now account for over 75% of global Bitcoin mining electricity use.
If U.S. miners went offline entirely, global mining energy demand would drop by roughly the same amount as Ireland’s annual electricity usage.
The Case of Kazakhstan
During 2025, Bitcoin mining in Kazakhstan consumed approximately 18,572 GWh from a total national grid output of about 97,000 GWh, meaning almost 1 in 5 watts produced in the country went to mining activity, per IEA statistics.
This level of consumption is especially problematic because of Kazakhstan’s coal-heavy electricity mix. In response, authorities have introduced higher grid fees and new taxes on mining facilities, although enforcement has been uneven.
Kazakhstan’s Bitcoin mining sector consumed more power in 2026 than the entire country used across its public healthcare system.
Other High Intensity Countries
Some smaller nations also show extreme Bitcoin mining electricity intensity:
- Paraguay: Uses 2.69% of its national power for mining, largely from surplus hydroelectricity at the Itaipu Dam (IEA Country Energy Profiles, 2024).
- Georgia: Around 2.49% of the country’s total energy use goes to Bitcoin mining, supported by a crypto-friendly tax regime and low-cost electricity (Cambridge CBECI, 2025).
- Ireland: Approximately 8.38% of electricity use is attributed to Bitcoin mining, driven by high-efficiency data centers and abundant wind power (EirGrid Generation Reports, 2025).
- Singapore: Despite urban density, Bitcoin mining accounts for 5.19% of total usage, pointing to optimized hosting infrastructure and low-latency server environments (Singapore EMA, 2024).
These countries benefit from either extremely cheap renewables or flexible energy regulation, especially in places like Georgia and Paraguay, where government policy actively incentivizes crypto infrastructure.
Ireland’s crypto mining sector now consumes more energy than its entire dairy processing industry.
Bitcoin’s Electricity Demand vs. Nations
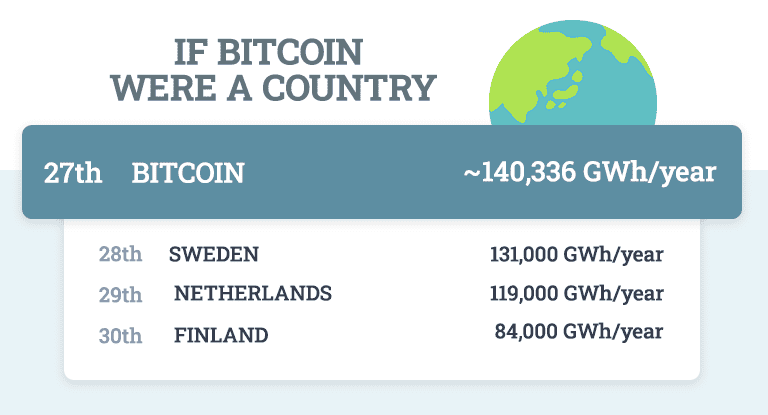
With an estimated global usage of 140,336 GWh/year, the Bitcoin network would rank:
- 27th globally for power consumption, just behind Argentina
- Ahead of Netherlands (119,000 GWh), Sweden (131,000 GWh), and Finland (84,000 GWh), according to Our World in Data and IEA Electricity Market Reports, 2025
Bitcoin uses more electricity per year than 160 countries, including the combined total of all nations in Central America.
Risks of Electricity Usage
Bitcoin’s design ties security directly to electricity use. As network activity and hashrate increase, electricity demand rises accordingly. But the concentration of mining in a few key locations introduces systemic risks:
- Regulatory risk: Localized crackdowns or energy taxes could rapidly displace hashrate
- Grid reliability: Surging demand in vulnerable areas like Texas has already led to emergency shutdowns during weather events (ERCOT Operations Reports, 2025)
- ESG pressure: Institutional investors are under increasing pressure to divest from carbon-heavy crypto operations
Although Bitcoin itself is decentralized, mining is fluid and relocates quickly. In 2026, we’ve already seen growth in hydro-abundant zones across Africa and Latin America, alongside off-grid expansions in the U.S. interior.
If Bitcoin were a country, it would rank among the top 30 electricity consumers on Earth.
Environmental Impact and CO₂ Emissions
The rise in electricity demand also comes with a measurable environmental cost. While some Bitcoin mining is powered by renewables, much of the global network still relies on fossil fuel-based grids. The carbon impact depends entirely on the local energy mix where the hashrate is concentrated.
In the United States, which accounts for 37.9 percent of global Bitcoin mining, the average grid emissions rate is approximately 0.38 kilograms of CO₂ per kilowatt-hour. Using the adjusted national energy consumption figure of 53,144,000,000 kilowatt-hours per year, the carbon output is:
53,144,000,000 kWh × 0.38 kg/kWh = 20,194,720,000 kg = 20.19 million tonnes of CO₂ per year
That makes US based Bitcoin mining one of the largest industrial emitters in the digital sector.
US Bitcoin mining in 2026 could emit as much CO₂ as 4.4 million petrol powered cars

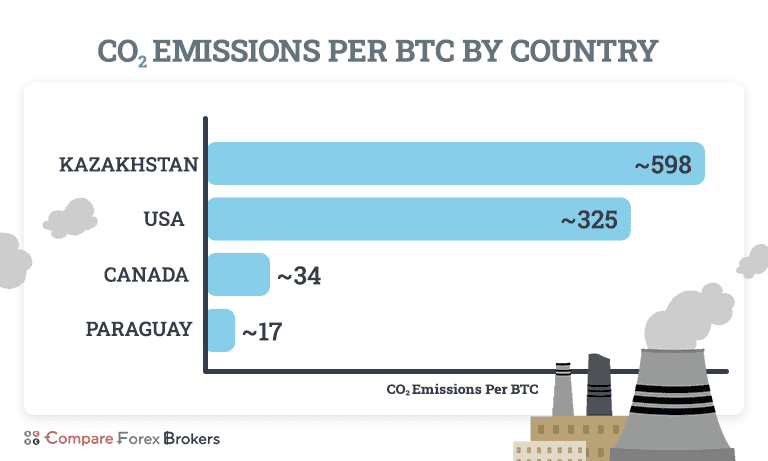
Globally, the impact is even more uneven. In countries like Kazakhstan, where Bitcoin mining uses 19.15 percent of the national grid, emissions are much higher per kilowatt-hour due to coal dependency. Kazakhstan’s average CO₂ intensity exceeds 0.7 kilograms per kilowatt-hour according to IEA emissions data. That means even a smaller mining footprint carries a larger environmental price.
Each block mined in Kazakhstan emits more CO₂ than flying from New York to Tokyo 150 times
By contrast, countries like Paraguay and Canada rely heavily on hydropower, resulting in near-zero carbon emissions per kilowatt-hour. A miner producing one Bitcoin in Paraguay may generate less than 5 percent of the CO₂ produced by a miner in Kazakhstan for the same output.
This energy asymmetry presents challenges for regulators and ESG-focused investors. Bitcoin’s proof-of-work model treats all hashrate equally, regardless of whether it is powered by coal or wind. But the environmental cost per Bitcoin can vary by a factor of 10 depending on geography.
CO₂ Emissions per Bitcoin by Country (2026)
| Country | Energy Source Mix | CO₂ Intensity (kg/kWh) | Emissions per BTC (tonnes CO₂) |
|---|---|---|---|
| Kazakhstan | Mostly coal | 0.70 | ~598 |
| United States | Mixed (gas, renewables) | 0.38 | ~325 |
| Canada | Predominantly hydro | 0.04 | ~34 |
| Paraguay | Almost entirely hydro | <0.02 | ~17 |
Sources
- CO₂ intensity data from International Energy Agency World Energy Statistics 2024
- Energy usage per BTC based on global post-halving mining calculations (854,403 kWh per BTC)
- Country energy mix data from Ember Climate.
USA Bitcoin mining emissions in 2026 exceed the annual CO₂ output of entire countries like Uruguay, Iceland and Namibia
As more scrutiny is placed on crypto emissions, miners with higher-carbon operations may face penalties, taxes or funding restrictions. Some U.S.-based firms already disclose renewable usage percentages in their filings to attract institutional capital. Others may relocate to regions with cleaner or cheaper grids to maintain access to financing.
Efforts to promote green Bitcoin have mostly focused on renewable energy reporting, off-grid installations or carbon credit schemes. But with global demand still rising and halving events forcing more energy per coin, the emissions question is becoming harder to separate from the economics of mining itself.
Where Bitcoin Mining Goes Next
With the halving behind us and electricity costs per Bitcoin at record highs, the mining landscape is being redrawn. Miners are no longer competing on hardware alone. They’re competing on energy, how cheap, how clean, and how consistent it is. Demand is also increasing with the risk of crypto CFD brokers amplifying the Bitcoin trading market.
Regions with stranded power, renewables oversupply, or flexible grid contracts are becoming the only viable environments for large-scale mining. Meanwhile, operators relying on grid electricity at commercial rates are increasingly being priced out.
As mining concentrates in fewer regions and emissions scrutiny grows, the next phase will be shaped by regulation as much as economics. Some countries will court miners with favorable energy terms. Others may push them out entirely. Mining isn’t disappearing. It’s relocating, and becoming more selective about where it plugs in.
Methodology
To calculate the energy cost of mining one Bitcoin in 2026, we start from the Cambridge Bitcoin Electricity Consumption Index rather than from a hardware specification. Read on 1 August 2026, CBECI estimated network power demand at 16.09 GW and annualised consumption at 141.02 TWh, within a modeled range of 8.61 to 28.19 GW. Cambridge builds that estimate from the hardware likely to be running and applies a facility-level overhead, so cooling and conversion losses are included rather than added afterwards.
Continuous draw of 16.09 GW gives 386 GWh per day. Against a daily issuance of 450 BTC (144 blocks × 3.125 BTC), the energy required to mine a single Bitcoin is approximately 858,000 kilowatt-hours. Dividing the same power estimate by the 878 EH/s network hashrate recorded on 31 July 2026 implies a fleet-wide efficiency near 18.3 J/TH, which we report as an output of the model rather than an input to it.
All cost calculations use the U.S. Energy Information Administration industrial electricity rate of 8.85 cents per kWh, the rolling twelve-month figure to May 2026 released on 23 July 2026. The industrial series is used rather than the commercial one because mining is an industrial load. Geographic mining distributions are sourced from the Cambridge Bitcoin Electricity Consumption Index (CBECI), with environmental emissions intensities by country from the International Energy Agency’s 2024 database.
The same methodology is applied to national estimates, including U.S. mining totals, by allocating proportionate hashrate shares and scaling consumption accordingly. All emissions figures reflect region-specific grid intensities and assume no offsetting renewable purchases unless explicitly documented. Energy-per-coin figures are derived uniformly to maintain comparability across regions.
Raw Data
Here is the raw data used in our analysis. This includes country-level hashrate, energy use, BTC mined per day, and the percentage of global consumption:
| Country | Hashrate [PH/s] | BTC mined / day | Power Consumption per hour [kWh] | Power Consumption per Day [GWh] | Power Consumption per Year [GWh] | Total Power Consumption [GWh] | Mining Consumption as % of Total Consumption | Calculated Daily Power [GWh] | Calculated Annual Power [GWh] | Calculated % of Total |
|---|---|---|---|---|---|---|---|---|---|---|
| United States | 229710 | 170.41 | 6066641 | 145.6 | 53143.78 | 3979000 | 1.34 | 145.5994 | 53143.78 | 1.335606 |
| China | 128180 | 95.09 | 3385234 | 81.25 | 29654.65 | 7806000 | 0.38 | 81.24562 | 29654.65 | 0.379896 |
| Kazakhstan | 80280 | 59.56 | 2120195 | 50.88 | 18572.91 | 97000 | 19.15 | 50.88468 | 18572.91 | 19.14733 |
| Canada | 39320 | 29.17 | 1038441 | 24.92 | 9096.74 | 555000 | 1.64 | 24.92258 | 9096.743 | 1.639053 |
| Russia | 28310 | 21 | 747667.1 | 17.94 | 6549.56 | 996000 | 0.66 | 17.94401 | 6549.564 | 0.657587 |
| Germany | 18590 | 13.79 | 490961.9 | 11.78 | 4300.83 | 512000 | 0.84 | 11.78309 | 4300.826 | 0.840005 |
| Malaysia | 15240 | 11.31 | 402488.4 | 9.66 | 3525.8 | 151000 | 2.33 | 9.659722 | 3525.798 | 2.334966 |
| Ireland | 11960 | 8.87 | 315863.6 | 7.58 | 2766.97 | 33000 | 8.38 | 7.580726 | 2766.965 | 8.384743 |
| Singapore | 11900 | 8.83 | 314279 | 7.54 | 2753.08 | 53000 | 5.19 | 7.542696 | 2753.084 | 5.194498 |
| Thailand | 5810 | 4.31 | 153442.1 | 3.68 | 1344.15 | 203000 | 0.66 | 3.68261 | 1344.153 | 0.662144 |
| Sweden | 5100 | 3.78 | 134691 | 3.23 | 1179.89 | 131000 | 0.9 | 3.232584 | 1179.893 | 0.900682 |
| Norway | 4480 | 3.32 | 118316.8 | 2.84 | 1036.46 | 131931 | 0.79 | 2.839603 | 1036.455 | 0.785604 |
| Hong Kong | 2610 | 1.94 | 68930.1 | 1.65 | 603.83 | 46000 | 1.31 | 1.654322 | 603.8277 | 1.312669 |
| Australia | 2170 | 1.61 | 57309.7 | 1.38 | 502.03 | 237000 | 0.21 | 1.375433 | 502.033 | 0.211828 |
| Indonesia | 2150 | 1.59 | 56781.5 | 1.36 | 497.41 | 282000 | 0.18 | 1.362756 | 497.4059 | 0.176385 |
| Brazil | 2000 | 1.48 | 52820 | 1.27 | 462.7 | 577000 | 0.08 | 1.26768 | 462.7032 | 0.080191 |
| United Kingdom | 1400 | 1.04 | 36974 | 0.89 | 323.89 | 287000 | 0.11 | 0.887376 | 323.8922 | 0.112854 |
| Georgia | 1400 | 1.04 | 36974 | 0.89 | 323.89 | 13000 | 2.49 | 0.887376 | 323.8922 | 2.491479 |
| Japan | 1370 | 1.02 | 36181.7 | 0.87 | 316.95 |
Sources
- Network hashrate: mempool.space three-day average, 31 July 2026
- Fleet efficiency: derived from CBECI network power demand divided by network hashrate, not assumed
- Electricity prices: U.S. Energy Information Administration industrial rate, rolling twelve months to May 2026, released 23 July 2026
- Mining distribution: Cambridge Bitcoin Electricity Consumption Index (CBECI), read 1 August 2026
- National electricity usage: International Energy Agency (IEA), World Energy Statistics, 2024
- Carbon intensity by country: IEA and Ember Climate, 2024
Looking for more newsworthy market analysis and credible datasets? You can also read our Top Forex Trading Countries research.



About the author

Justin Grossbard is the CEO & Co-Founder of CompareForexBrokers established in 2014, along with Noam Korbl and works as Strategic Head Of Research.
Our reviews are reader-supported. We may receive payment when you click a link to a partner site. Learn how we make money.