

If you’re looking to understand the scale of the UK forex market or see how it compares to other financial hubs, our analysis below provides a clear snapshot of trading activity, liquidity, and trader demographics.
Last updated July 2026. BIS figures reflect the final revised 2025 Triennial Survey dataset (June 2026). Broker loss rates are captured from live UK risk warnings on the date shown.
Forex statistics by region: Global | Australia | UK | USA
Top 5 UK Forex Facts
- London handles 37.9% of all forex trading worldwide
- $4.7 trillion is traded daily on UK forex markets
- London trades more per day than the USA and Singapore combined
- Global fx turnover grew 2x as fast from 2022-25 (27%) as it did 2019-22 (14%)
- EUR/USD and GBP/USD make up 35% of the UK’s forex turnover
UK’s Role in Global Foreign Exchange
In 2025, the United Kingdom’s foreign exchange market is handling $4.7 trillion USD per day, equal to 37.9% of global turnover. That scale means more currency changes hands in London every single day than the UK’s annual GDP. With a 27.0% increase from 2022, annualised UK forex turnover now runs to roughly $1.2 quadrillion a year, based on 252 trading days.
More currency changes hands in London in a single day ($4.74 trillion) than the UK economy produces in a year: daily turnover runs about 18% above annual GDP of roughly $4.0 trillion (IMF, 2025).
While many assume New York markets in the United States (US) turn over the most foreign exchange, they average $2.33 trillion daily, about $588 trillion a year based on 252 trading days, which equates to a significantly lower 18.7% market share. The gap between the UK and US has actually widened since 2019, with London gaining ground while New York’s share has remained broadly stable. Together the two still account for more than half of all global forex activity, but London alone now processes nearly twice as much as its closest rival.
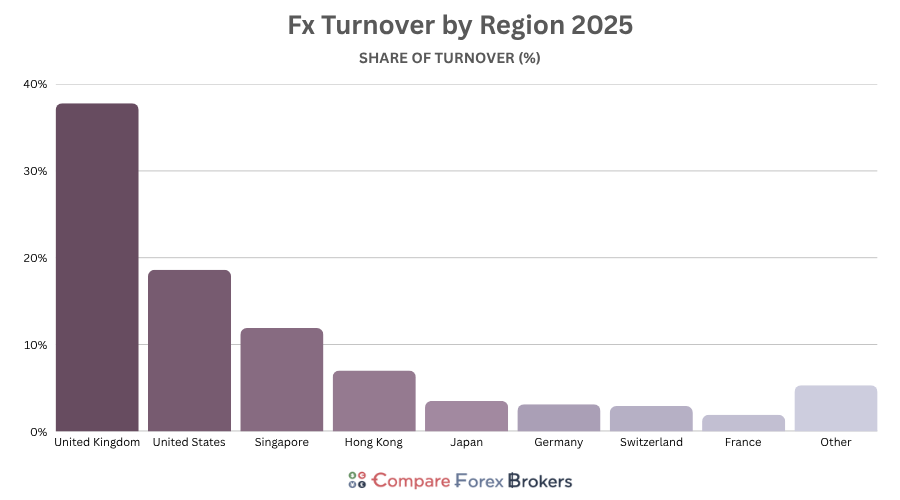
UK handles 37.9% of all FX trading, nearly double the US share of 18.7%
The UK’s larger share comes down to its time zones bridging Asia and US markets, meaning trading stays active through more of the day, and the fact London concentrates interdealer and prime broker flow that anchors pricing for the rest of the market. These factors mean forex spreads are low, and depth is high, so more orders are routed through UK markets.
London vs Other Major Financial Hubs
London is the largest foreign exchange hub in the world, trading more each day than New York and Singapore combined. Its $4.7 trillion daily turnover gives it a scale unmatched by any other centre, a position it has held for decades.
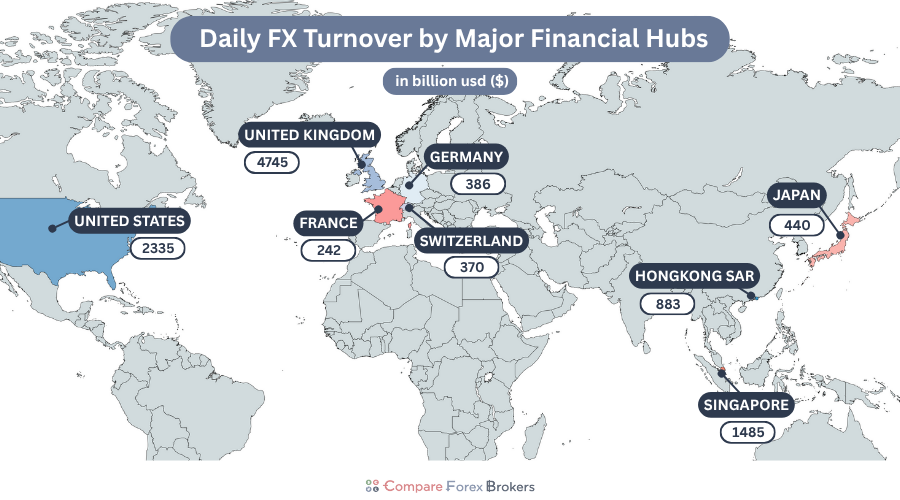
Daily FX Turnover by Major Financial Hubs
London’s daily $4.7 trillion turnover is more than double New York’s $2.3 trillion and triple Singapore’s $1.5 trillion. Together, the UK and US account for 56.6% of the world’s forex trading, confirming activity is still based around these two centres despite Asia’s growing share.
| Country/Hub | Daily turnover ($bn) |
|---|---|
| United Kingdom | 4,743 |
| United States | 2,335 |
| Singapore | 1,485 |
| Hong Kong SAR | 883 |
| Japan | 440 |
| Germany | 386 |
| Switzerland | 371 |
| France | 242 |
Singapore has seen the biggest shift among Asian hubs over the past 15 years. In 2010, it held less than 5% of global turnover, compared with 11.9% today. This rise has been driven by Asia’s economic expansion, the internationalisation of the Chinese yuan, and stronger regional hedging flows.
As a result, Singapore now handles more forex trading than Tokyo and Hong Kong combined, cementing its role as Asia’s main financial gateway.
Daily Turnover on Global Forex Markets
Foreign exchange is the largest financial market, turning over $9.51 trillion per day worldwide, or roughly $2.4 quadrillion a year based on 252 trading days. Global trading volumes increased by 27% between 2022 and 2025, up from $7.47 trillion per day in 2022, roughly double the 14% increase seen in the 2019 – 2025 period prior.
The key factors influencing this positive growth are interest rate gaps reviving carry trading, companies and asset managers hedging more currency risk, and electronic platforms keeping liquidity available across more hours and more currency pairs.
Market Share by Instrument in the UK
What are the most commonly traded fx products?
The most commonly traded FX products are swaps, spot, and outright forwards, which together account for 90% of UK daily turnover. Swaps lead with 38.2% of trading, followed by spot at 29.9% and forwards at 22.0%.
- $1.81 trillion were FX swaps
- $1.42 trillion spot
- $1.04 trillion outright forwards
- $0.10 trillion currency swaps
- $0.38 trillion options
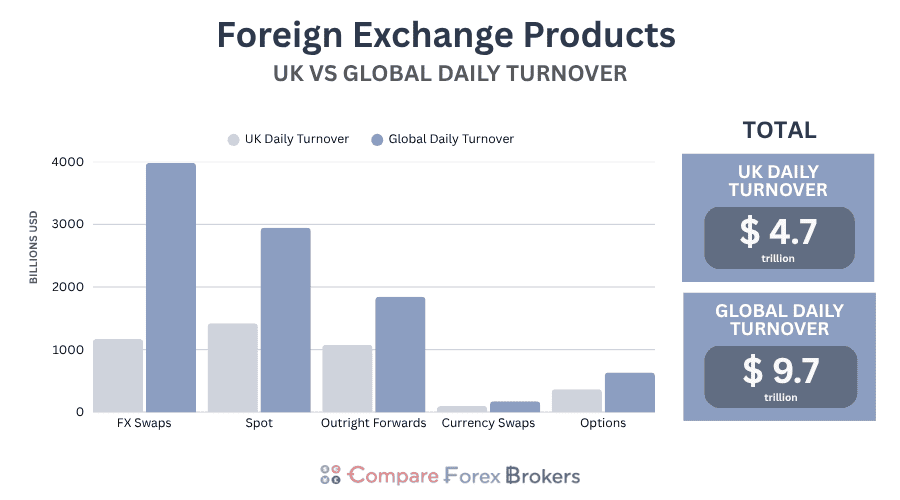
This mix shows London’s role in short dated funding and hedging, with swaps providing the pricing backbone for spot and forward markets
| Fx Product | UK Daily Turnover ($bn) | UK Share (%) | Global Daily Turnover ($bn) | Global Share (%) |
|---|---|---|---|---|
| FX Swaps | 1,809 | 38.2% | 4,015 | 42.2% |
| Spot | 1,418 | 29.9% | 2,952 | 31.0% |
| Outright Forwards | 1,042 | 22.0% | 1,747 | 18.4% |
| Currency Swaps | 97 | 2.1% | 164 | 1.7% |
| Options | 376 | 7.9% | 632 | 6.6% |
| Total | 4,743 | 9,510 |
Top 10 Most Traded Currencies in the UK
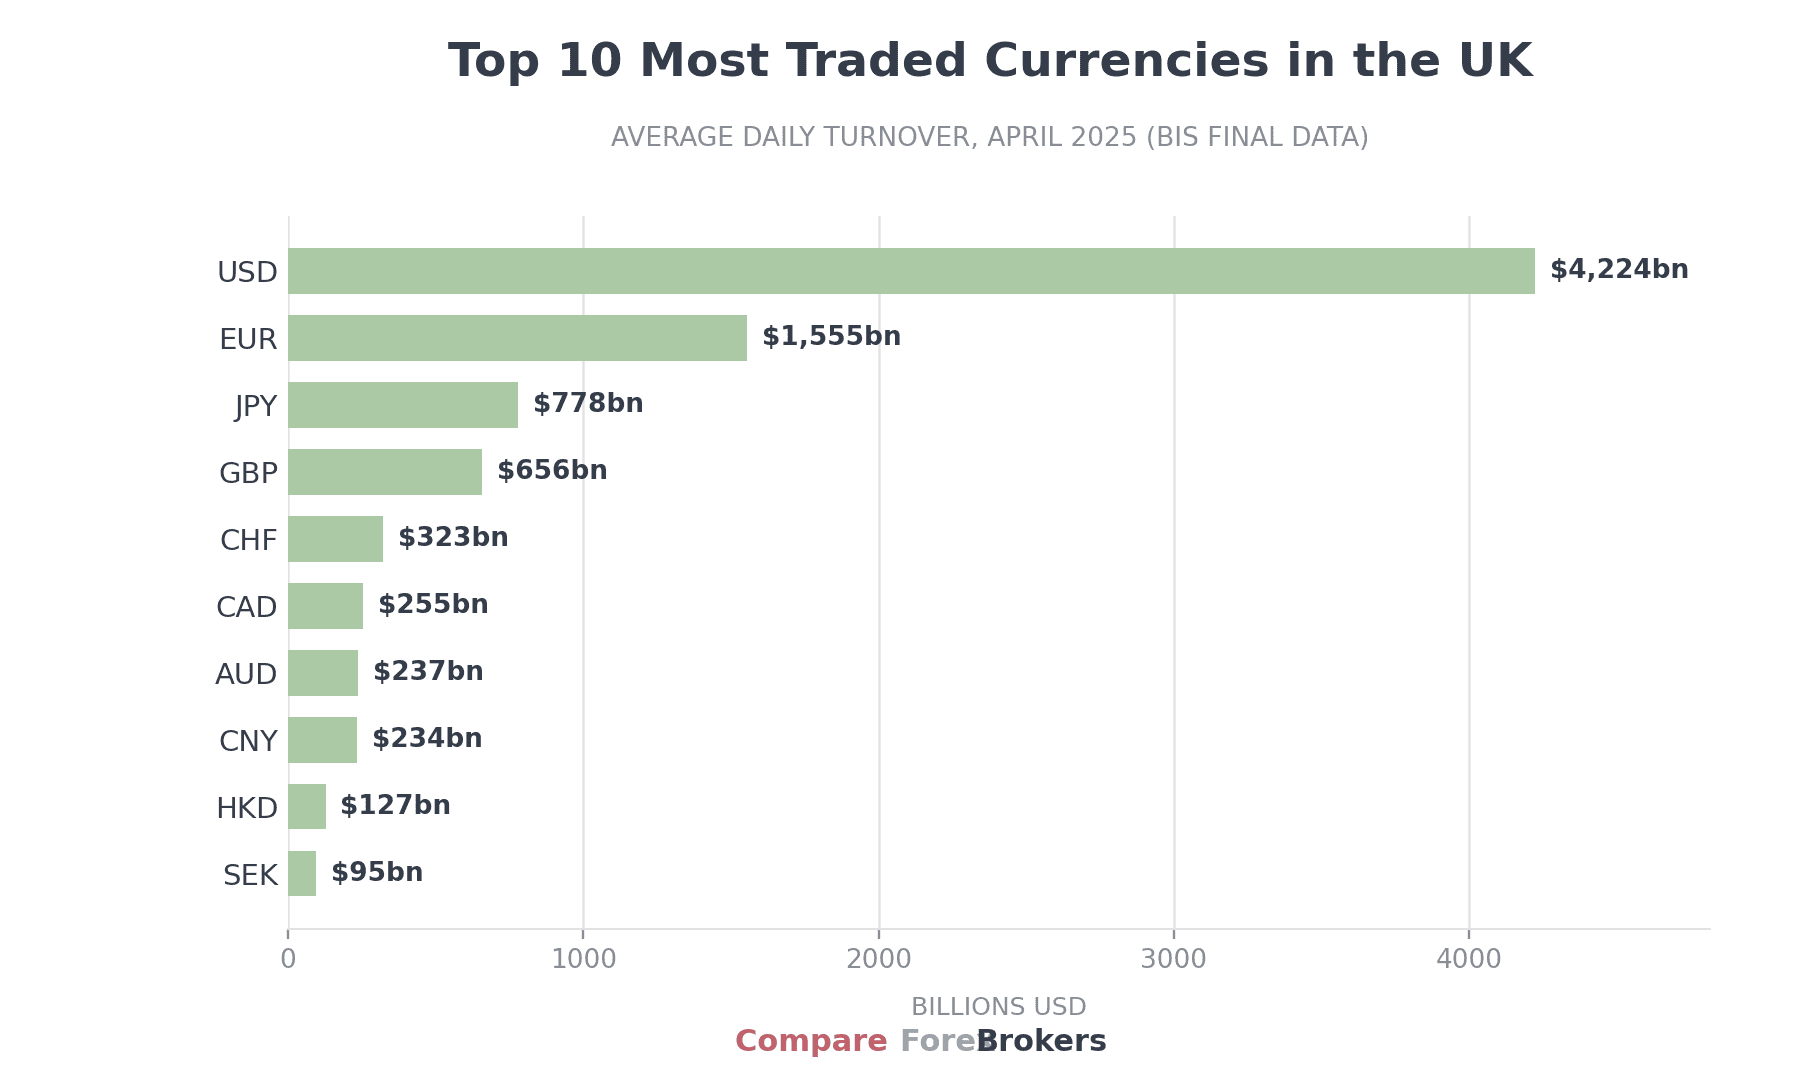
The dollar is the most traded currency in the UK, and involved in almost every trade accounting for 89.1% of UK turnover (very close to its worldwide share). The euro is second most traded with a 32.8% share in the UK, slightly higher than the global average, showing London’s role as a hub for euro-dollar trading.
Sterling accounts for 13.8% of UK turnover, above its 10.2% global share
Source: BIS Triennial Survey 2025, final revised data (June 2026)
Top 10 most traded currencies in the UK by average daily turnover are:
- US Dollar (USD) $4,224bn
- Euro (EUR) $1,555bn
- Japanese Yen (JPY) $778bn
- British Pound (GBP) $656bn
- Swiss franc (CHF) $323bn
- Canadian Dollar (CAD) $255bn
- Australian Dollar (AUD) $237bn
- Chinese Renminbi (CNY) $234bn
- Hong Kong Dollar (HKD) $127bn
- Swedish Krona (SEK) $95bn
London handles $234 billion a day in renminbi, the largest offshore RMB market outside Asia, though Hong Kong remains the biggest offshore centre overall at $315 billion. Relative to its 8.6% global currency share, the yuan is actually under-represented in London, since most of its trading happens in China, Hong Kong and Singapore. By contrast, the Hong Kong dollar is relatively under-traded in the UK at 2.7%, less than half its global share, as most HKD liquidity stays in Asian centres.
The Swedish krona edges out the Singapore dollar for the final spot, one of the quirks of London’s role as Europe’s FX hub.
| Country | USD | EUR | JPY | GBP | CNY | CHF | AUD | CAD | HKD | SGD |
|---|---|---|---|---|---|---|---|---|---|---|
| UK ($m) | 4,223,827 | 1,554,776 | 777,542 | 655,935 | 234,137 | 322,917 | 236,692 | 254,805 | 126,966 | 89,133 |
| UK (%) | 89.1% | 32.8% | 16.4% | 13.8% | 4.9% | 6.8% | 5.0% | 5.4% | 2.7% | 1.9% |
| USA ($m) | 2,121,323 | 639,687 | 368,917 | 244,642 | 134,064 | 156,067 | 177,146 | 222,425 | 53,367 | 52,956 |
| USA (%) | 90.9% | 27.4% | 15.8% | 10.5% | 5.7% | 6.7% | 7.6% | 9.5% | 2.3% | 2.3% |
| Germany ($m) | 268,650 | 260,761 | 32,921 | 36,855 | 7,649 | 34,608 | 7,935 | 8,718 | 4,368 | 2,645 |
| Germany (%) | 38.3% | 37.2% | 4.7% | 5.3% | 1.1% | 4.9% | 2.1% | 1.2% | 0.6% | 0.4% |
| France ($m) | 200,183 | 161,455 | 29,586 | 28,022 | 2,818 | 14,105 | 5,665 | 6,496 | 2,253 | 1,936 |
| France (%) | 40.9% | 33.0% | 6.0% | 5.7% | 0.6% | 2.9% | 2.3% | 1.3% | 0.5% | 0.4% |
| Singapore ($m) | 1,394,617 | 203,396 | 346,254 | 78,797 | 146,727 | 52,639 | 140,493 | 34,515 | 97,181 | 118,874 |
| Singapore (%) | 93.9% | 13.7% | 23.3% | 5.3% | 9.9% | 3.5% | 9.5% | 2.3% | 6.5% | 8.0% |
| Worldwide ($m) | 8,471,519 | 2,714,074 | 1,608,341 | 966,558 | 817,467 | 601,003 | 582,450 | 547,467 | 366,700 | 232,300 |
| Worldwide (%) | 89.1% | 28.5% | 16.9% | 10.2% | 8.6% | 6.3% | 6.1% | 5.8% | 3.9% | 2.4% |
Most Traded Currency Pairs in UK
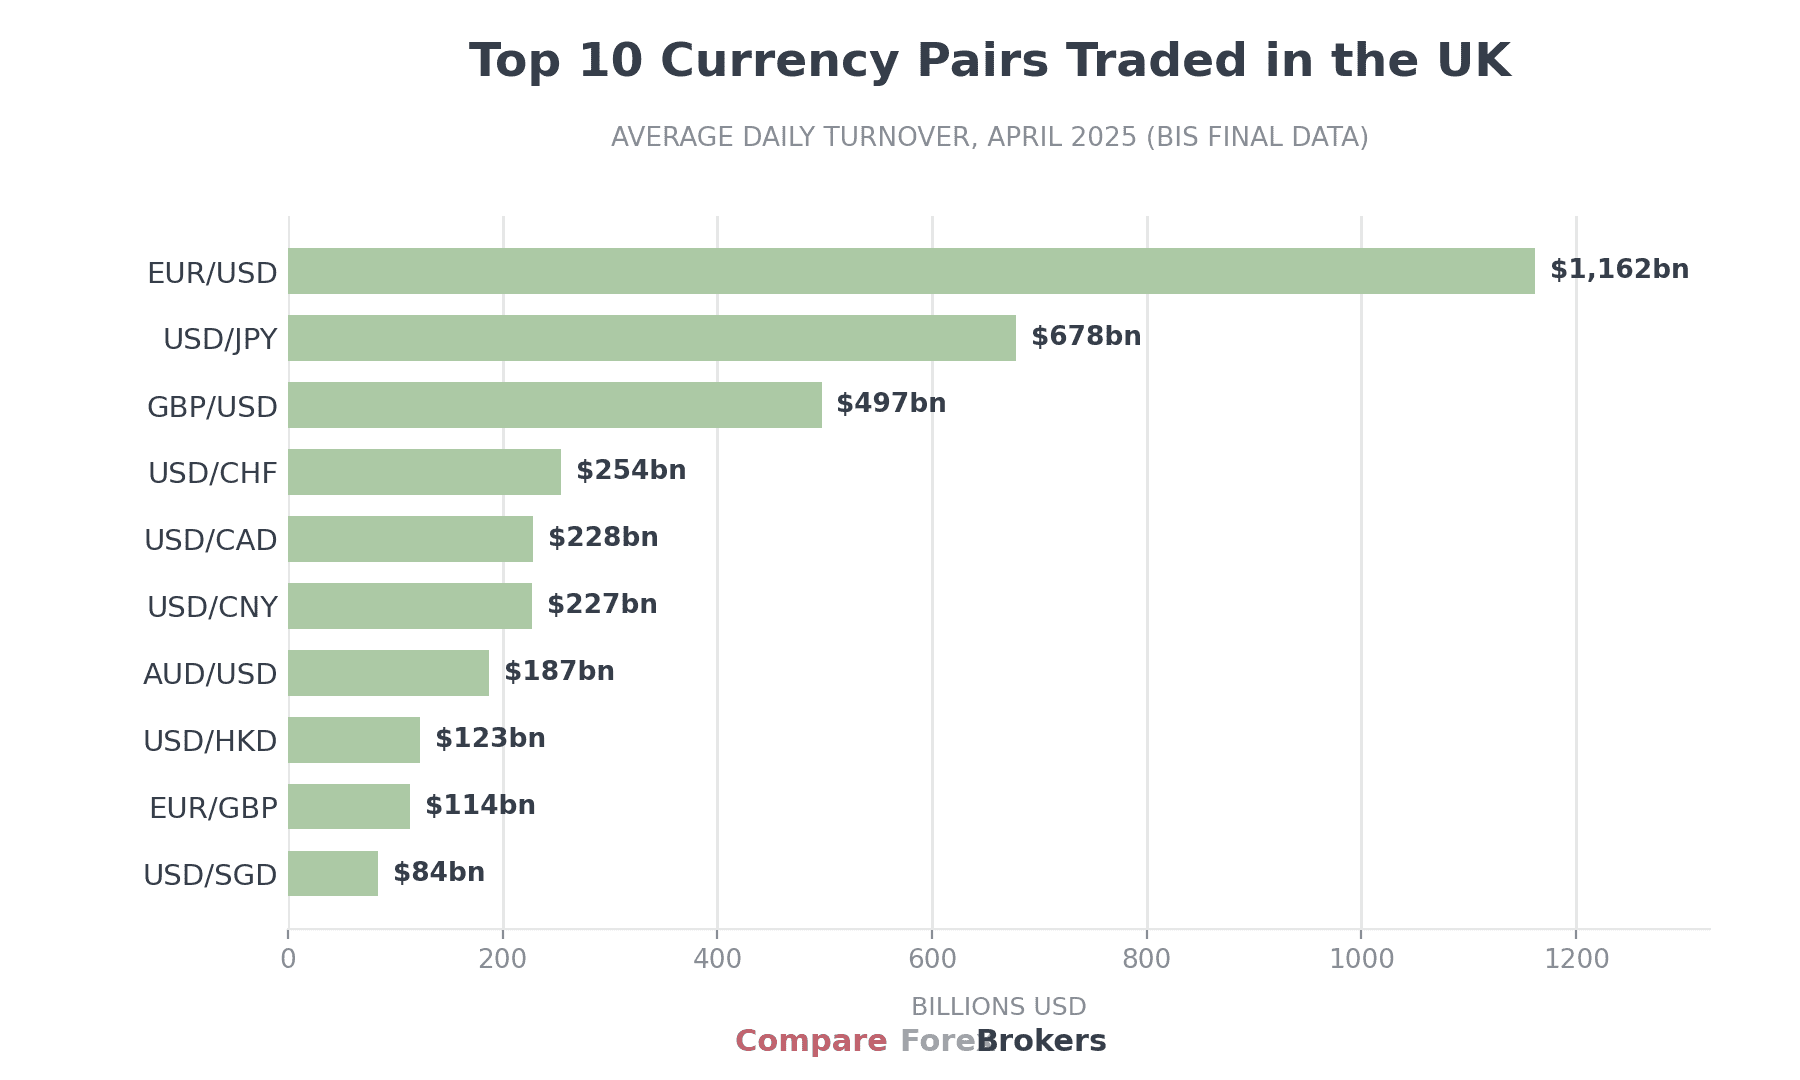
The most traded currency pair in the UK is EUR/USD, with $1.16 trillion daily turnover, followed by USD/JPY at $678 billion and GBP/USD at $497 billion.
EUR/USD alone accounts for 24.5% of everything traded in London. Together with GBP/USD it covers 35% of UK turnover.
The dominance of dollar pairs reflects the USD’s role as the world’s settlement currency, while London’s unique time zone position makes it a hub for trading both US and European currencies.
Top 10 most traded currency pairs in the UK by average daily turnover are:
| Pair | UK daily turnover 2025 | 2022 |
|---|---|---|
| EUR/USD | $1,162bn | $1,019bn |
| USD/JPY | $678bn | $439bn |
| GBP/USD | $497bn | $543bn |
| USD/CHF | $254bn | $164bn |
| USD/CAD | $228bn | $220bn |
| USD/CNY | $227bn | $139bn |
| AUD/USD | $187bn | $163bn |
| USD/HKD | $123bn | $57bn |
| EUR/GBP | $114bn | $95bn |
| USD/SGD | $84bn | $56bn |
GBP/USD is the one major pair shrinking in London: turnover fell from $543 billion in 2022 to $497 billion in 2025, and USD/JPY overtook it as the city’s second most traded pair.
London’s trading profile shows some clear differences from our global forex statistics. GBP/USD ranks third in London and fourth worldwide, and about two thirds of all GBP/USD trading passes through London, underlining the home advantage of sterling trading.
EUR/GBP makes the UK top 10 but is not the global shortlist, showing sterling’s home bias
By contrast, USD/HKD ranks higher globally (thanks to Asian hubs) but is only 2.7% of UK turnover, since most liquidity in the Hong Kong dollar stays closer to its home market.
Source: BIS Triennial Survey 2025, final revised data (June 2026)
What are the Most Traded GBP Currency Pairs Worldwide?
The most traded GBP currency pairs worldwide are GBP/USD and EUR/GBP, which together account for about 93% of sterling’s global turnover. GBP/USD averages about $731 billion globally, of which $497 billion trades through London, reflecting its role as a bridge between US and UK markets.
EUR/GBP follows at around $169 billion per day globally, while other frequently traded sterling pairs include GBP/JPY, GBP/CHF, and GBP/AUD, often influenced by interest rate differences and overlapping trading hours.
Forex Traders in the UK
The FCA’s Financial Lives 2024 survey found 39% of UK adults (21.2 million people) hold investments of some kind, and separate FCA research puts crypto ownership at around 12% of adults, roughly 7 million people. Leveraged trading is a far smaller pool: the FCA estimates its CFD protections benefit nearly 400,000 retail investors a year (October 2025). Risk awareness remains the regulator’s core concern. Its consumer research found 45% of self-directed investors did not view losing money as a risk of investing, and its 2016 CFD analysis found 82% of clients lost money, an average of about 2,200 pounds per client per year, the evidence base behind today’s 30:1 leverage caps.
What percentage of forex traders are successful?
Most retail forex traders in the UK lose money, with data from the local regulator, the Financial Conduct Authority (FCA), showing 70 to 80% end up with net losses over time. The FCA’s Financial Lives 2024 survey pointed out that many traders underestimate risk and overestimate their ability to profit, with one in four high risk investors describing themselves as unwilling to take risks despite actively trading.
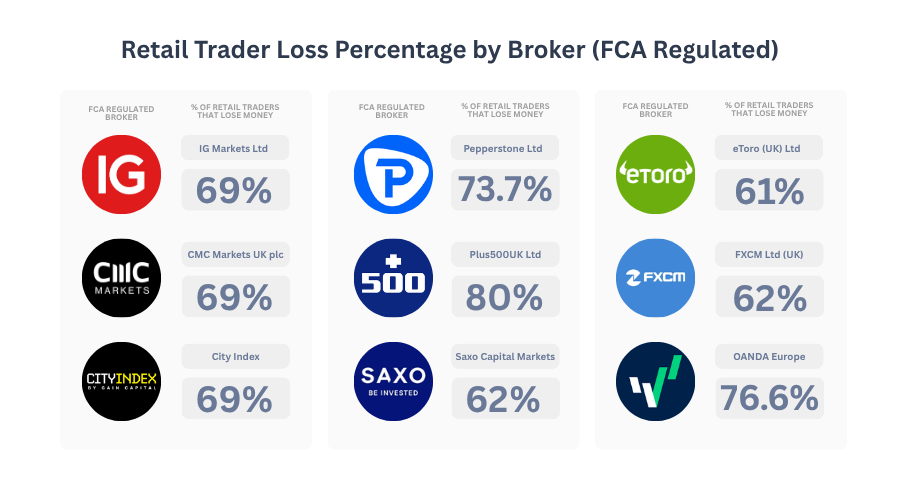
FCA data suggests only 20 to 30% of UK retail forex traders are profitable, meaning around three quarters lose money.
The few who succeed tend to trade with discipline, risk limits, and longer horizons, but they are in the minority.
| FCA Regulated Broker | % of Retail Traders That Lose Money |
|---|---|
| IG Markets Ltd | 69% |
| CMC Markets UK plc | 68% |
| City Index (GAIN Capital UK) | 70% |
| Pepperstone Ltd (UK) | 72.9% |
| Plus500UK Ltd | 76% |
| Saxo Capital Markets UK Ltd | 59% |
| eToro (UK) Ltd | 52% |
| FXCM Ltd (UK) | 67% |
| OANDA Europe (UK site) | 76.6% |
Loss rates as published in each broker’s UK risk warning, captured 4 July 2026.
Our Methodology
The foreign exchange trading statistics in this article are mostly drawn from the Bank for International Settlements (BIS) Triennial Central Bank Survey 2025, the most comprehensive global review of foreign exchange and derivatives activity, which captures turnover by country, instrument, and currency.
UK retail trading insights are taken from the Financial Conduct Authority’s Financial Lives Survey 2024 and its Consumer Investments Data Review 2024, which provide detailed information on participation, demographics, and outcomes among UK traders.
Sources
- BIS Triennial Central Bank Survey 2025
- FCA Financial Lives Survey 2024
- FCA Consumer Investments Data Review 2024

Sources And Methodology
BIS Triennial Survey 2025, final revised dataset (June 2026 release): survey hub, final annex tables (XLSX), revised summary tables (XLSX). Additional sources: FCA Financial Lives 2024, FCA CFD investor warning (October 2025), FCA CP16/40, broker UK risk warnings captured 4 July 2026, IMF WEO (UK GDP). Annualised figures on this page use 252 trading days.