
Figures are based on official Bank for International Settlements (BIS) and US regulatory data, providing an overview of how America’s foreign exchange market compares globally in 2025.
Last updated July 2026. BIS figures reflect the final revised 2025 Triennial Survey dataset (June 2026). Broker deposit figures come from the CFTC’s monthly FCM reports, month as captioned.
Forex statistics by region: Global · Australia · UK · USA
What are the top five US forex statistics?
- $2.33 trillion is traded daily at US forex markets in 2025
- US forex turnover increased 22.1% since 2022, adding $422 billion a day in volume
- London trades 2.03x more than New York, a daily gap of $2.41 trillion
- The US dollar is involved in 89.1% of all global currency trades
- The 3 top US retail brokers handle over 80% of all US forex obligations
What is the role of the USA in global forex markets?
The United States is the second largest forex trading hub in the world, turning over $2.33 trillion per day, up 22.1% from $1.91 trillion in 2022. While US markets’ annual turnover is significant at about $588 trillion a year based on 252 trading days, UK forex markets are still 103% larger, averaging roughly $1.2 quadrillion a year.
The wider dataset these US figures come from is published as Foreign Exchange Industry Data.
The US accounts for 18.7% of all global forex turnover, second to the UK.
Although most activity goes through London markets, the US dollar is involved in 89.1% of all global forex trades, showing how it anchors prices and payments worldwide. It is the default currency many deals are quoted and settled in, which keeps US institutions central even when trades are booked elsewhere.
The US dollar was on one side of nearly 9 out of 10 forex trades worldwide.
Daily Turnover of Foreign Exchange
The increase in US daily market turnover from $1.91 trillion to $2.33 trillion this year was driven by higher dollar volatility, interest rate divergence, and stronger hedging activity across global markets.
Global forex turnover climbed to $9.51 trillion per day in 2025, up 27% from $7.47 trillion in 2022. For context, global equity markets trade about $0.8 trillion per day (WFE, 2025), making forex more than ten times larger. The rise in global fx turnover can be attributed to greater participation from non-bank financial institutions, more algorithmic execution, and stronger demand for dollar liquidity as interest rates and inflation expectations reset after the pandemic period.
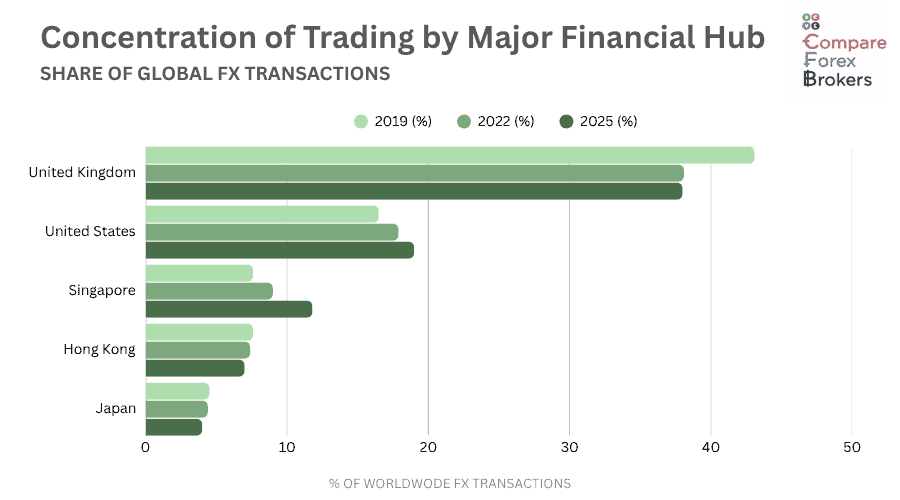
The UK remains by far the largest trading centre, with $4.74 trillion traded daily, followed by the USA, then Singapore at $1.48 trillion, and Hong Kong at $0.88 trillion.
London traded about 2.03× as much as New York, a gap of $2.41 trillion per day.
Although the UK widened its lead, US growth remains significant in absolute terms. The US added roughly $422 billion in daily trading since 2022, more than Germany’s entire daily forex market turnover. The US market’s stability comes down to deep institutional participation, electronic market access, and its role in funding global dollar positions.
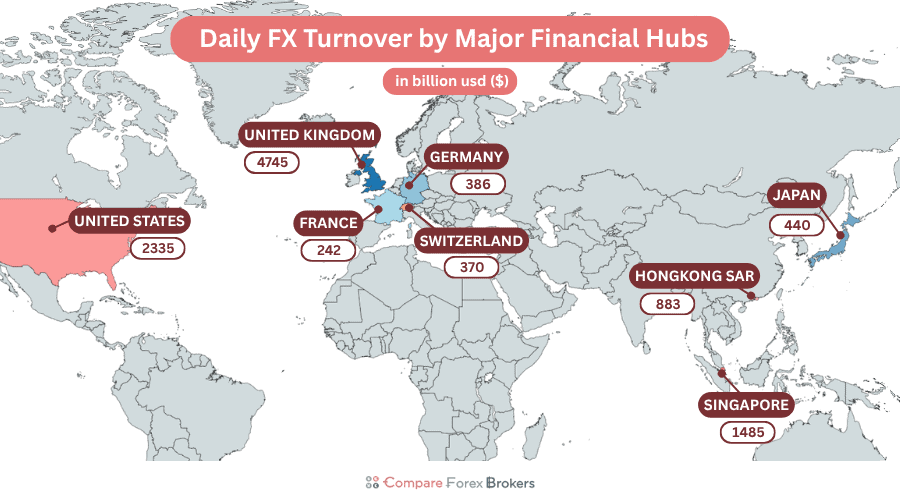
Together, the UK and US handle over $7 trillion of FX trades each day, more than the rest of the world combined.
Singapore has been the clear mover among major financial hubs, turning over $1.48 trillion daily in 2025. Its share of global turnover increased to 11.9% this year, up from 9.5% in 2022 and 7.6% in 2019. The shift reflects more trading during Asian hours, stronger hedging of China and ASEAN exposure, and easier electronic access for global investors.
Singapore now links Tokyo’s morning with the run up to London, handling more of the day’s G10 and emerging market currency risk before Europe takes over.
| Hub | 2025 daily turnover (USD bn) | 2025 market share | Change vs 2022 |
|---|---|---|---|
| United Kingdom | 4,742.6 | 37.9% | +27.0% |
| United States | 2,334.7 | 18.7% | +22.1% |
| Singapore | 1,485.2 | 11.9% | +59.8% |
| Hong Kong SAR | 883.0 | 7.1% | +27.2% |
| Japan | 440.2 | 3.5% | +1.8% |
| Germany | 386.1 | 3.1% | +110.0% |
| Switzerland | 370.5 | 3.0% | +6.0% |
| France | 242.2 | 1.9% | +13.3% |
| China | 235.1 | 1.9% | +54.0% |
| Canada | 232.7 | 1.9% | +35.3% |
| Australia | 200.9 | 1.6% | +33.6% |
What is Traded at US Desks?
At US desks, most trading is the dollar against a handful of major currencies, led by the euro, yen, and pound. Trading activity in the US remains concentrated in the major G10 currencies, which provide deep liquidity and tight pricing for institutions and corporations. The euro, yen, and pound make up just over half of all turnover, while the Canadian dollar follows closely, supported by strong crossborder trade and energy flows.
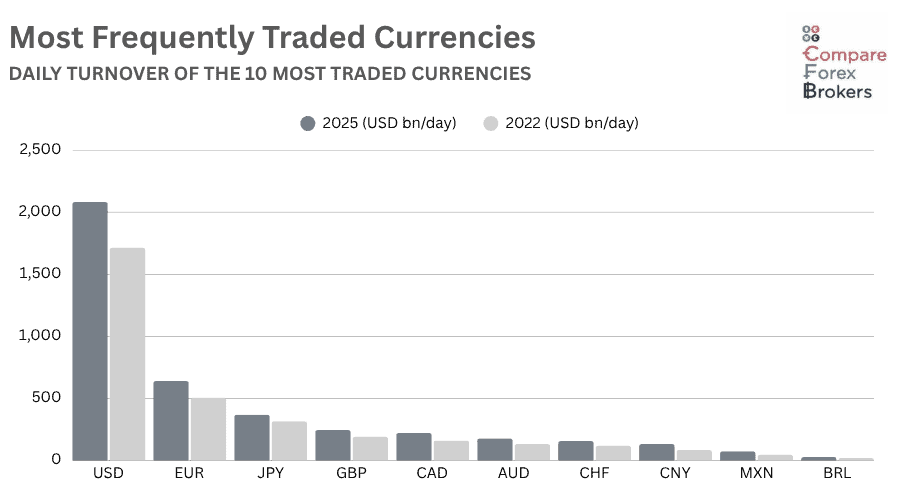
The 10 most traded currencies in the USA are:
- US Dollar (USD) $2,121bn (90.9% of US turnover)
- Euro (EUR) $639bn
- Japanese Yen (JPY) $369bn
- British Pound (GBP) $245bn
- Canadian Dollar (CAD) $222bn
- Australian Dollar (AUD) $177bn
- Swiss Franc (CHF) $156bn
- Chinese Renminbi (CNY) $134bn
- Mexican Peso (MXN) $75bn
- Hong Kong Dollar (HKD) $53bn
Daily turnover is in billions of USD
Beyond the traditional majors, trading in the renminbi, peso, and real has grown quickly as US firms and investors manage more exposure to emerging markets. The rise in renminbi trading highlights deeper financial links with China, even though most RMB liquidity remains booked in Asian centres.
EUR, JPY and GBP together make up 53.7% of all currencies traded at US desks.
Compared with global averages, the US market leans more heavily toward North American and Western Hemisphere currencies. CAD and MXN feature far more prominently than they do globally, showing the importance of regional trade and energy markets, while the renminbi’s share is smaller since most of its liquidity remains centred in Asia.
Overall, the mix at US desks mirrors America’s dual role in global finance, anchoring the dollar’s dominance while maintaining deep trading ties with both advanced and emerging markets across the Americas and Asia.
Most Frequently Traded Currency Pairs
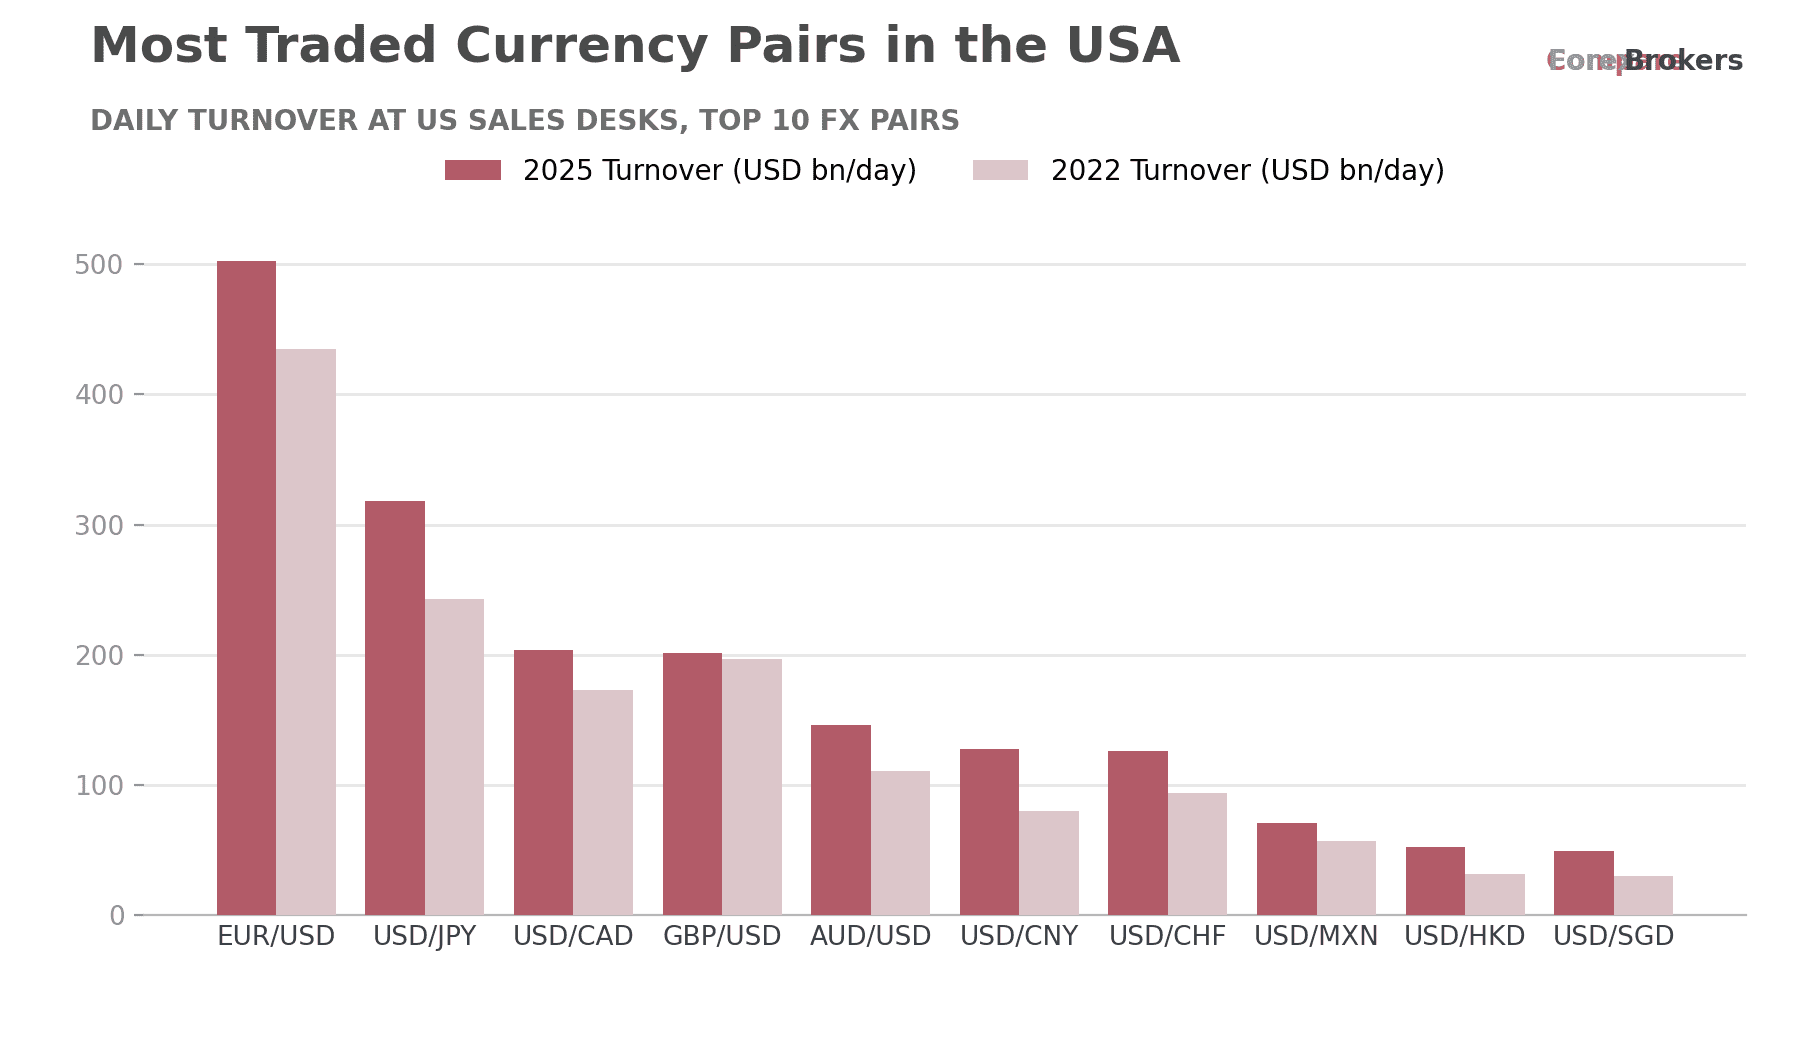
The most traded currency pairs in the United States are EUR/USD, USD/JPY, and GBP/USD, which together account for about 44% of all forex turnover in the USA. These three pairs anchor daily liquidity and pricing across global markets, with EUR/USD remaining the benchmark for institutional trading.
Source: BIS Triennial Survey 2025, final revised data (June 2026)
The 10 most traded forex pairs in the US are:
- EUR/USD $502bn
- USD/JPY $318bn
- USD/CAD $204bn
- GBP/USD $201bn
- AUD/USD $146bn
- USD/CNY $128bn
- USD/CHF $126bn
- USD/MXN $71bn
- USD/HKD $52bn
- USD/SGD $49bn
Daily turnover is in billions of USD
US forex trading is incredibly concentrated in the major dollar pairs, with EUR/USD continuing to lead by a wide margin, averaging more than $502 billion in daily volume. While USD/JPY activity has grown sharply in response to persistent interest rate differentials between the US and Japan. GBP/USD also remains a core pair, supported by strong cross Atlantic financial links and hedging demand.
EUR/USD remains the most traded pair at US desks, averaging over $502 billion a day.
The next tier, being USD/CHF, AUD/USD, and USD/CNY, reflects the importance of New York in managing risk for other G10 currencies, particularly those tied to commodity and safe-haven flows.
Further down the list, USD/MXN, USD/HKD, and USD/SGD make it apparent US forex trading has gone well beyond traditional G10 currencies. The inclusion of the Chinese yuan, Mexican peso, and Hong Kong dollar points to deeper financial links with Asia and Latin America, as US companies and funds hedge exposure to emerging markets.
| Rank | Currency Pair | 2025 Turnover (USD billions per day) | 2022 Turnover (USD billions per day) | Change (%) |
|---|---|---|---|---|
| 1 | EUR/USD | 502 | 435 | +15.3 |
| 2 | USD/JPY | 318 | 243 | +30.7 |
| 3 | USD/CAD | 204 | 173 | +18.0 |
| 4 | GBP/USD | 201 | 197 | +1.8 |
| 5 | AUD/USD | 146 | 111 | +31.9 |
| 6 | USD/CNY | 128 | 80 | +58.8 |
| 7 | USD/CHF | 126 | 94 | +34.5 |
| 8 | USD/MXN | 71 | 57 | +25.6 |
| 9 | USD/HKD | 52 | 32 | +59.8 |
| 10 | USD/SGD | 49 | 30 | +66.7 |
What Instruments are Traded The Most in The USA?
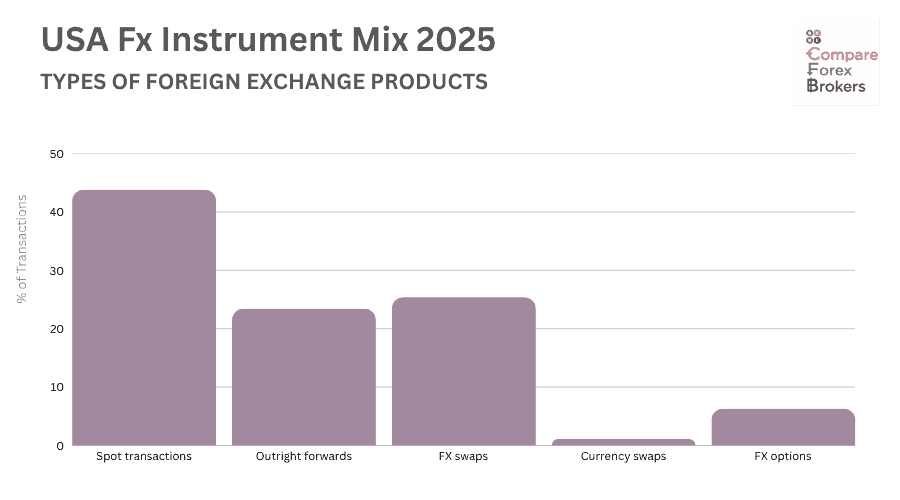
Spot trading remains the most common type of foreign exchange transaction in the United States, making up about 44% of all activity in 2025. However, swaps and forwards together now account for nearly half of daily turnover, showing how institutions use FX not just to trade currencies, but to manage funding and hedge against future risks.
Spot trading makes up 44% of US forex turnover, equal to around $1.02 trillion a day.
Spot transactions total around $1.02 trillion each day, followed by FX swaps at $594 billion and outright forwards at $546 billion. Options and currency swaps make up a smaller share of the market but are still essential tools for managing volatility and longer-term exposure.
The US market has shifted gradually toward more complex instruments since 2022, as companies and investors face higher interest rates and greater uncertainty. Swaps are used mainly for short term dollar funding, while forwards and options help firms hedge predictable cash flows or protect against currency swings.
| Instrument | Turnover (USD billions per day) | Share of US total (%) |
|---|---|---|
| Spot transactions | 1,021 | 43.8 |
| Outright forwards | 546 | 23.4 |
| FX swaps | 594 | 25.4 |
| Currency swaps | 26 | 1.1 |
| FX options | 148 | 6.3 |
Which brokers dominate retail forex in the USA?
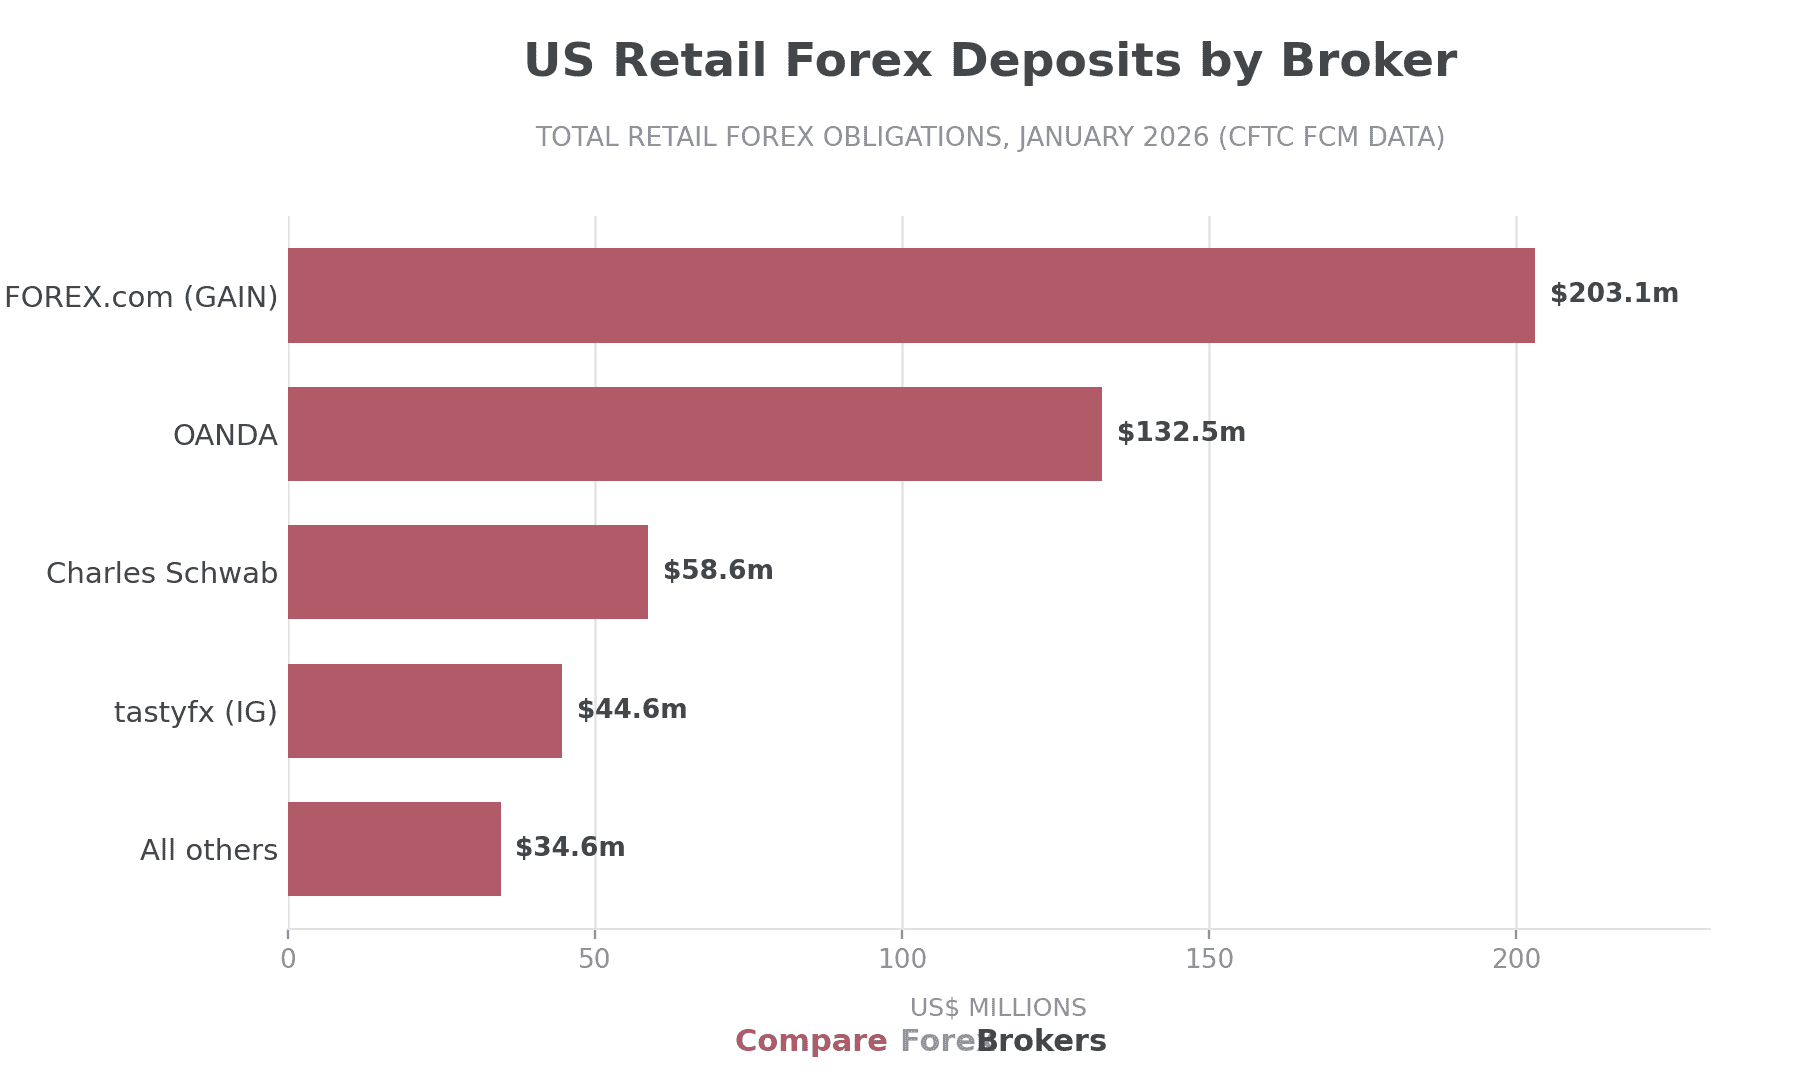
Three major brokers dominate US retail forex. In the latest CFTC monthly data (May 2026), FOREX.com (GAIN Capital) held $201.6 million in retail forex obligations, OANDA $135.7 million and Charles Schwab Futures and Forex $54.7 million, together over 80% of the roughly $471 million total. tastyfx, IG Group’s US brand since its 2024 rebrand from IG US, holds most of the remainder alongside Interactive Brokers. OANDA was acquired by prop-trading firm FTMO in early 2025 and moved its prop clients to the FTMO brand in 2026, narrowing its US retail focus.
Source: CFTC FCM monthly financial data, January 2026
Just 3 US brokers hold just over 80% of US customer forex obligations in 2026
US rules on leverage, advertising and broker registration keep the retail market tightly controlled and focused on experienced traders. The entire stock of regulated retail balances, about $0.47 billion, is roughly 0.02% of a single day of wholesale FX traded at US desks ($2.33 trillion), showing how small the retail segment is relative to institutional markets.
Retail forex balances in the US equal just 0.02% of a single day’s institutional FX turnover
US Forex Trader Demographics
Retail forex traders in the United States tend to be experienced, financially literate investors with access to multiple asset classes. FINRA’s National Financial Capability Study (2024) found 34% of US adults hold taxable investment accounts outside retirement plans, and within this group, an estimated 2 to 3% trade leveraged forex directly through registered brokers.
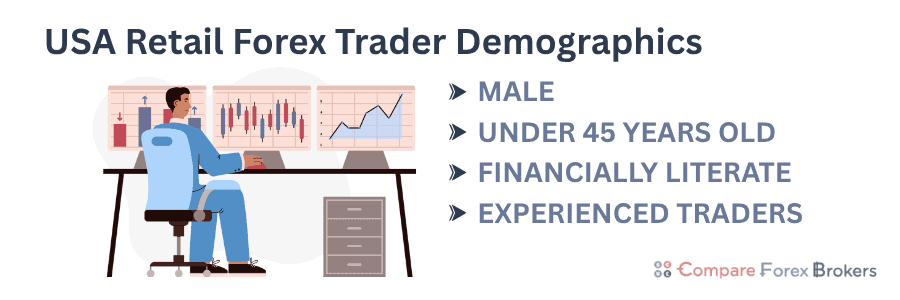
Retail forex traders in the US tend to be younger males, with men under 45 remain the most active demographic, with the share of younger traders rising as mobile trading platforms and digital access have expanded. Forex CFDs cannot legally be offered to US retail clients, so American currency exposure runs through spot forex at CFTC-registered dealers, currency ETFs and futures. On the crypto side, the Federal Reserve’s SHED survey puts cryptocurrency use at around 10% of US adults (2025 survey).
About a third of US adults (34%, NFCS 2024) have taxable investment accounts, but only 2 to 3% trade leveraged forex directly
These figures underline a key difference between the US and other regions, with the majority of American retail traders gaining forex exposure indirectly through multi asset platforms or funds, rather than via high leverage spot trading.
How many forex traders are profitable?
When US dealers were required to publish quarterly profitability under CFTC rules, the disclosures from 2011 to 2017 consistently showed roughly 25% to 35% of retail forex accounts profitable in any given quarter. Aggregated public reporting has since stopped, but European regulator data tells the same story: ESMA found 74% to 89% of retail CFD accounts lose money.
While profitability remains low, US rules on leverage and margin requirements help limit overall losses. USA forex traders face stricter capital and risk limits than their counterparts in Europe or Asia, reducing the number of account wipe outs seen during periods of volatility.
When dealers published quarterly data (2011 to 2017), roughly 25% to 35% of US retail forex accounts were profitable in a given quarter.
Over time, the US retail market has shifted toward more experienced traders who focus on risk management, algorithmic trading systems, and multi asset diversification. This has improved account longevity, even if overall profit rates have not changed.
Forex Scams and Consumer Protection in the US
Strict regulation has made the US one of the safest major retail forex markets, but scams still occur, especially online. Americans reported a record $15.9 billion lost to all fraud in 2025, up about 25% on 2024, according to the FTC’s Consumer Sentinel data. Investment scams were the costliest category at $7.9 billion, and imposter scams took another $3.5 billion. The gap between categories matters for traders: the median investment-scam victim lost $9,196 in the 2024 data book, nearly twenty times the median across all fraud types.
Investment scams cost Americans $7.9 billion in 2025, the costliest fraud category in FTC data.
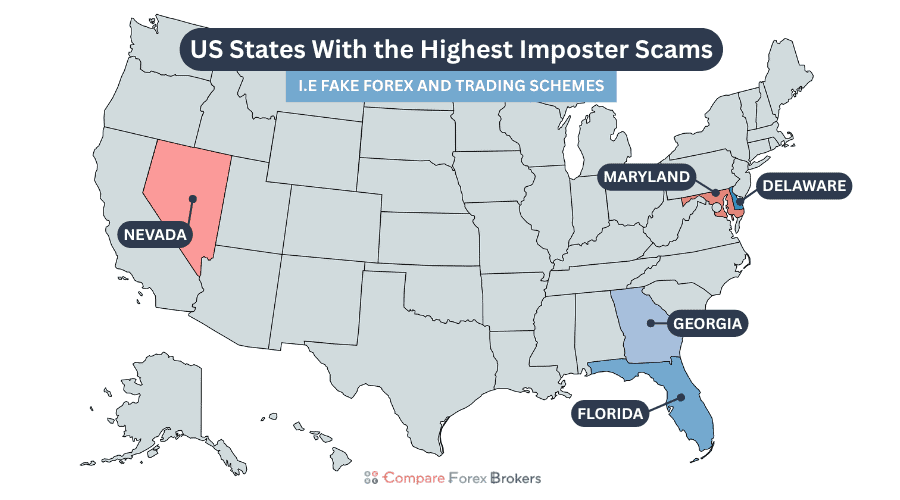
Fraud reports are most common in states such as Florida, Georgia, Delaware, Nevada, and Maryland, where large retiree populations and online investment marketing overlap. Despite this, the US remains one of the most tightly policed markets in the world.
The Commodity Futures Trading Commission (CFTC), National Futures Association (NFA), and Securities and Exchange Commission (SEC) jointly oversee retail forex trading activity, requiring all online brokers to be registered, properly capitalised, and fully transparent in how they handle client funds.
These agencies’ combined oversight keeps leverage limits low and stops unregulated offshore firms from targeting US residents. As a result, losses from regulated trading remain far smaller than in regions with lighter enforcement, even as online scams become more sophisticated using social media and offshore platforms.
US Retail Forex Rules At A Glance
The CFTC caps retail leverage at 50:1 on major pairs and 20:1 on minors, far below the 500:1 offered offshore. NFA Compliance Rule 2-43b imposes first-in-first-out (FIFO) order accounting and bans hedging the same pair in one account. Only a handful of firms are registered to deal retail forex: FOREX.com (StoneX), OANDA, tastyfx (IG Group), Interactive Brokers and Charles Schwab Futures and Forex. Every legitimate dealer appears in the NFA’s BASIC registry, and client funds sit with firms holding at least $20 million in regulatory capital.
Our Methodology
All data and analysis in this report are drawn from official, regulator-verified, and publicly released sources. Figures are taken from the most recent editions available as of 2025, and all monetary values are expressed in US dollars (USD) on a daily average basis, unless otherwise stated. Market share calculations follow the conventions set by the Bank for International Settlements (BIS), using by-location, net-gross figures for individual countries and net-net figures for global totals.
Wherever possible, US-specific statistics have been cross-checked with corresponding global data to provide context and comparability. Growth rates represent percentage changes between the 2022 and 2025 survey periods. Retail data are derived from official regulatory filings submitted by licensed institutions under US Commodity Futures Trading Commission (CFTC) oversight.
Sources
- Bank for International Settlements (BIS), Triennial Central Bank Survey of Foreign Exchange and OTC Derivatives Markets, April 2025
- Commodity Futures Trading Commission (CFTC), Financial Data for Futures Commission Merchants (FCMs), May 2026 (Total Amount of Retail Forex Obligation)
- Financial Industry Regulatory Authority (FINRA), Financial Capability in the United States 2025, National Financial Capability Study (NFCS)
- Securities and Exchange Commission (SEC), THRIVE 2025 Perspectives on Investing in the United States
- Federal Trade Commission (FTC), Consumer Sentinel Network Data Book 2024
- CFTC, Financial Data for FCMs (monthly retail forex obligations), cftc.gov/MarketReports/financialfcmdata
- US Department of the Treasury, Report on Foreign Exchange Policies of Major Trading Partners of the United States, 2024
- World Federation of Exchanges, WFE Dashboard, April 2025


Sources And Methodology
BIS Triennial Survey 2025, final revised dataset (June 2026 release): survey hub, final annex (PDF, June 2026), preliminary annex tables (XLSX, September 2025), preliminary summary tables (XLSX, September 2025). Additional sources: CFTC monthly FCM financial data (May 2026), Federal Reserve SHED 2025, FINRA NFCS 2024, FTC Consumer Sentinel data (2025), WFE market highlights (FY 2025). Annualised figures on this page use 252 trading days.
Related topics
Our reviews are reader-supported. We may receive payment when you click a link to a partner site. Learn how we make money.
About the author

Justin Grossbard is the Co-Founder and CEO of CompareForexBrokers, which he established with Noam Korbl in 2014. He has over 20 years of professional experience in online marketing and holds a Master's in Marketing from Monash University.