
Last updated July 2026. BIS figures reflect the final revised 2025 Triennial Survey dataset (June 2026 release). AFXC figures are from the April and October 2025 semi-annual surveys.
Forex statistics by region: Global · Australia · UK · USA
Top 5 Forex Facts In Australia

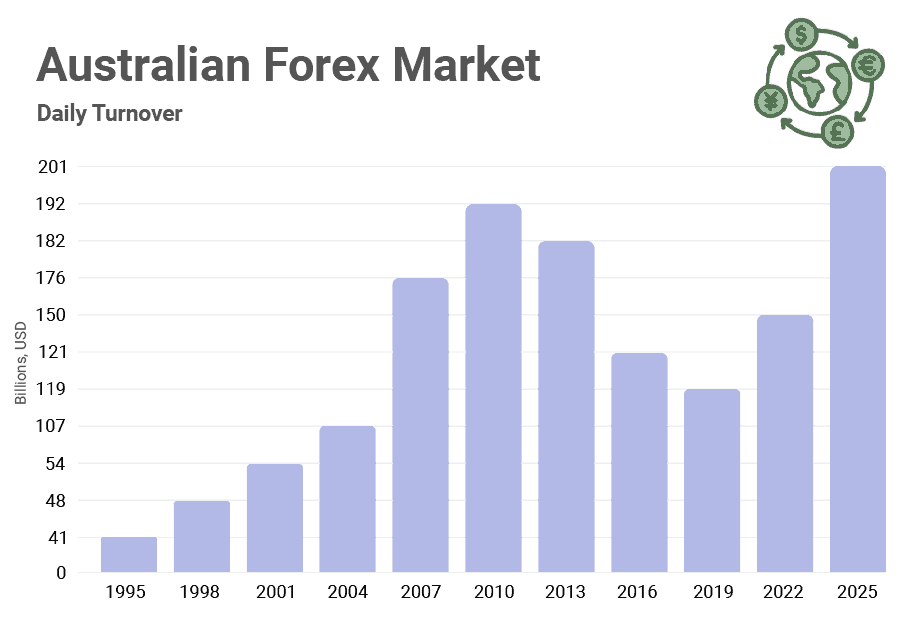
- The Australian forex market averaged USD $201 billion per day in April 2025, up from USD $150 billion in 2022 (a 34% increase)
- The Aussie dollar (AUD) dropped from the 6th most traded currency in the world to the 7th most traded currency. Overall the AUD made up 6.1% of the global forex turnover in 2025.
- 1.2% of turnover was by retail-driven Forex trading, totalling USD $2.4 billion per day. 75% of Forex turnover was between banks
- Over half of Australia’s forex trading was for short-term currency deals (USD $107b). Spot made up USD $51 billion, forwards $36 billion, currency swaps $6 billion and options $1.2 billion.
- Australia is also a big hub for interest rate derivatives, with daily trading totalling USD $252b or 3.2% of global volume.
1. Australia’s Role in the Global Forex Market
In April 2025, Australia recorded USD $201 billion in average turnover (versus $150 billion in 2022). That’s a rise of 34% in 3 years, outpacing the global average of 27%.
Retail forex traders account for $2.4 billion of the overall turnover (1.2% of local turnover). This is lower than the global average, which is 2.5%.
Justin Grossbard, Co-Founder of CompareForexBrokers, said, “In just 30 years, the forex market has increased 5-fold to USD $201 billion per day”.
Global Comparison
Globally, forex turnover reached USD $9.51 trillion per day. While the UK, USA, Singapore, and Hong Kong remain the largest hubs (combining for over 75% of global flows), the increase in Australian market turnover means Australia is catching up.
For more info on London being the largest trading hub worldwide, read our UK forex statistics.
| Rank | Market Hub | Daily Turnover (USD Billions) | Share Of Global |
|---|---|---|---|
| 1 | UK | $4,742.6 | 37.9% |
| 2 | USA | $2,334.7 | 18.7% |
| 3 | Singapore | $1,485.2 | 11.9% |
| 4 | Hong Kong SAR | $883.0 | 7.1% |
| 5 | Japan | $440.2 | 3.5% |
| 6 | Germany | $386.1 | 3.1% |
| 7 | Switzerland | $370.5 | 3.0% |
| 8 | France | $242.2 | 1.9% |
| 9 | China | $235.1 | 1.9% |
| 10 | Canada | $232.7 | 1.9% |
| 11 | Australia | $200.9 | 1.6% |
Some of the abbreviations on this page are expanded to the regulator's full name: a broker regulated by ASIC is regulated by the Australian Securities and Investments Commission.
Australia is the 11th largest forex trading centre. China’s onshore market ($235 billion a day) and Canada ($233 billion) both edged ahead of it in 2025.
The AFXC’s follow-up survey shows turnover eased to US$178.6 billion a day in October 2025, confirming that April’s record was inflated by the volatility around US trade policy announcements that month. The RBA also notes that related-party trades now make up about half of Australian turnover; excluding them, the underlying market has been broadly flat for several years.
2. Instruments Traded In Australia
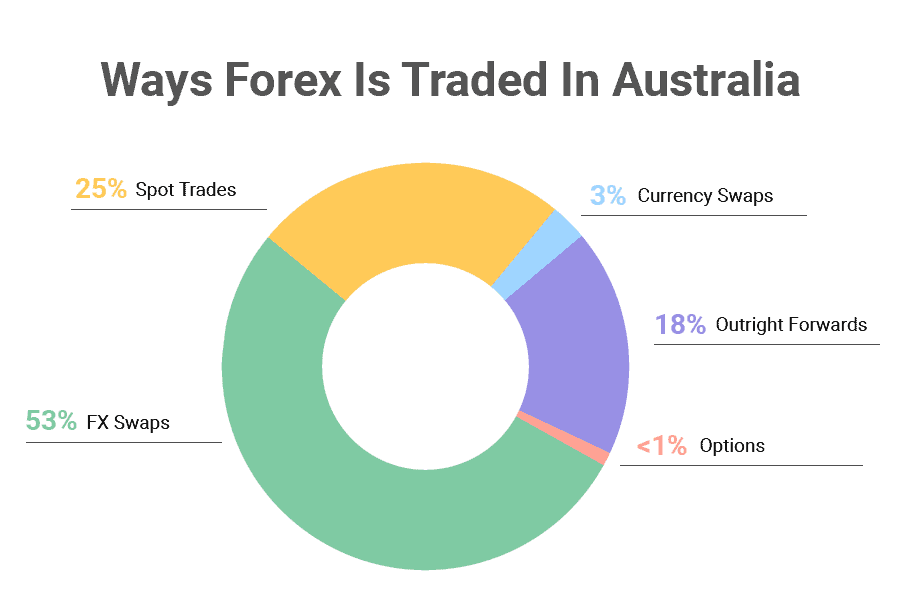
In Australia, Forex Swaps is the financial instrument of choice to trade Forex making up USD $107 billion or 53% of the market. This is higher than the 42% that make up Forex swaps globally. Spot trading with Forex by contrast only makes up USD $51 billion.
Future-dated deals (aka forwards) is responsible for USD $36 billion which essentially are agreements today for an exchange at a set date and rate in the future. Other instruments (currency swaps and options) account for the remaining turnover.
Who Trades Forex In Australia
- Reporting dealers (banks): USD 151 billion, 75%These are the large international and domestic banks that act as market makers. They are the core of interbank trading and provide most of the liquidity in the market.
- Other financial institutions: USD 40 billion (20%)This category includes non-reporting banks, institutional investors, hedge funds, proprietary trading firms, and retail-focused forex brokers.
- Non-financial customers: USD 10 billion (5 %)This covers corporates, exporters/importers, and government entities using FX to manage trade flows or reserves.
Local forex brokers (like Pepperstone) aggregate orders from retail and professional clients, then pass them through to the interbank market via reporting dealers. These only account for USD $2.4 billion per day or 1.2% of local forex trading (vs 2.5% globally), Justin Grossbard
3. The Popularity Of The Aussie Dollar
In April 2025, the Aussie dollar (AUD) was involved in 6.1% of global forex turnover (about USD $582 billion each day). This made the AUD the 7th most popular currency traded overall (dropping from 6th in 2022). This drop to 7th is due to the rise in the Swiss franc.
Unsurprisingly, the US dollar is the dominant currency worldwide with 89.1% of trades worldwide involving the USD. For more on this, read our USA forex statistics.
Most Popular Global Currency Pairs
From a global perspective, the most traded currencies traded against each other are the EURO and USD (EUR/USD) accounting for 21.2% of volume. This is followed by USD/JPY (14.3%) and then USD/CNY (8.1%).
| Rank | Currency Pair | Daily Turnover (USD billions) | Share of Global Turnover (%) |
|---|---|---|---|
| 1 | EUR/USD | 2,033 | 21.2% |
| 2 | USD/JPY | 1,372 | 14.3% |
| 3 | USD/CNY | 781 | 8.1% |
| 4 | GBP/USD | 731 | 7.6% |
| 5 | USD/CAD | 505 | 5.3% |
| 6 | AUD/USD | 467 | 4.9% |
| 7 | USD/CHF | 467 | 4.9% |
| 8 | USD/HKD | 347 | 3.6% |
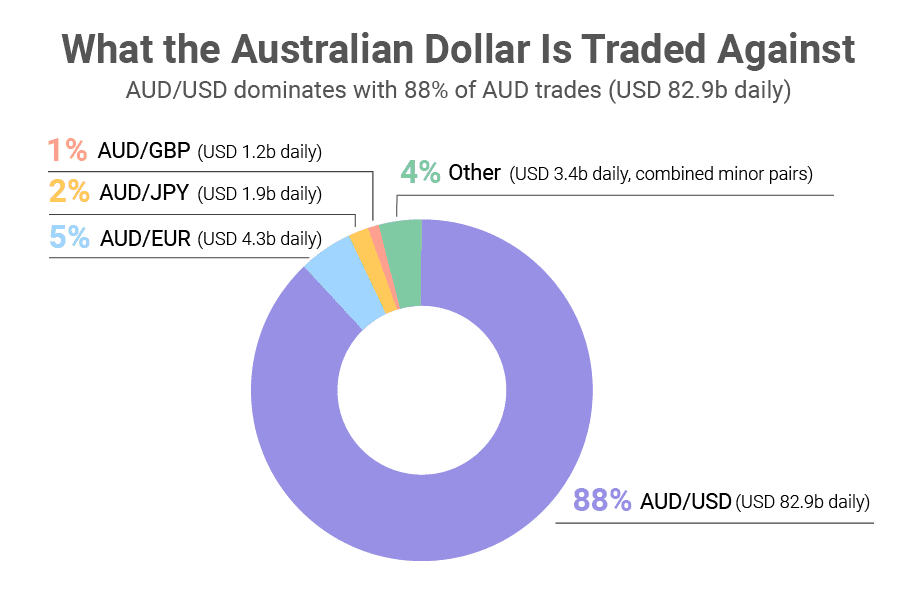
In 2022, the AUD/USD was the 6th most traded currency pair globally and accounted for 5.1% of global daily turnover. Its share eased slightly to 4.9% in 2025, though it still ranks 6th among traded pairs.
Over the past three years the biggest increase in volume has been for the Chinese Yuan. The USD/CNY rose from 6.6% of turnover in 2022 to 8.1% in 2025, making it the third most traded pair. The Swiss franc moved the other way, climbing from a 5.2% share in 2022 to 6.3% in 2025 and overtaking the Australian dollar, which is exactly why the AUD now sits seventh among currencies. USD/CHF was the fastest growing major pair, up from 3.9% to 4.9% of global turnover.
The yuan’s rise into the top three most popular Forex pairs to trade highlights China’s growing trade power, while the Swiss franc’s climb shows renewed demand for safe-haven currencies., Justin Grossbard
4. The Length Of Trades In Australia
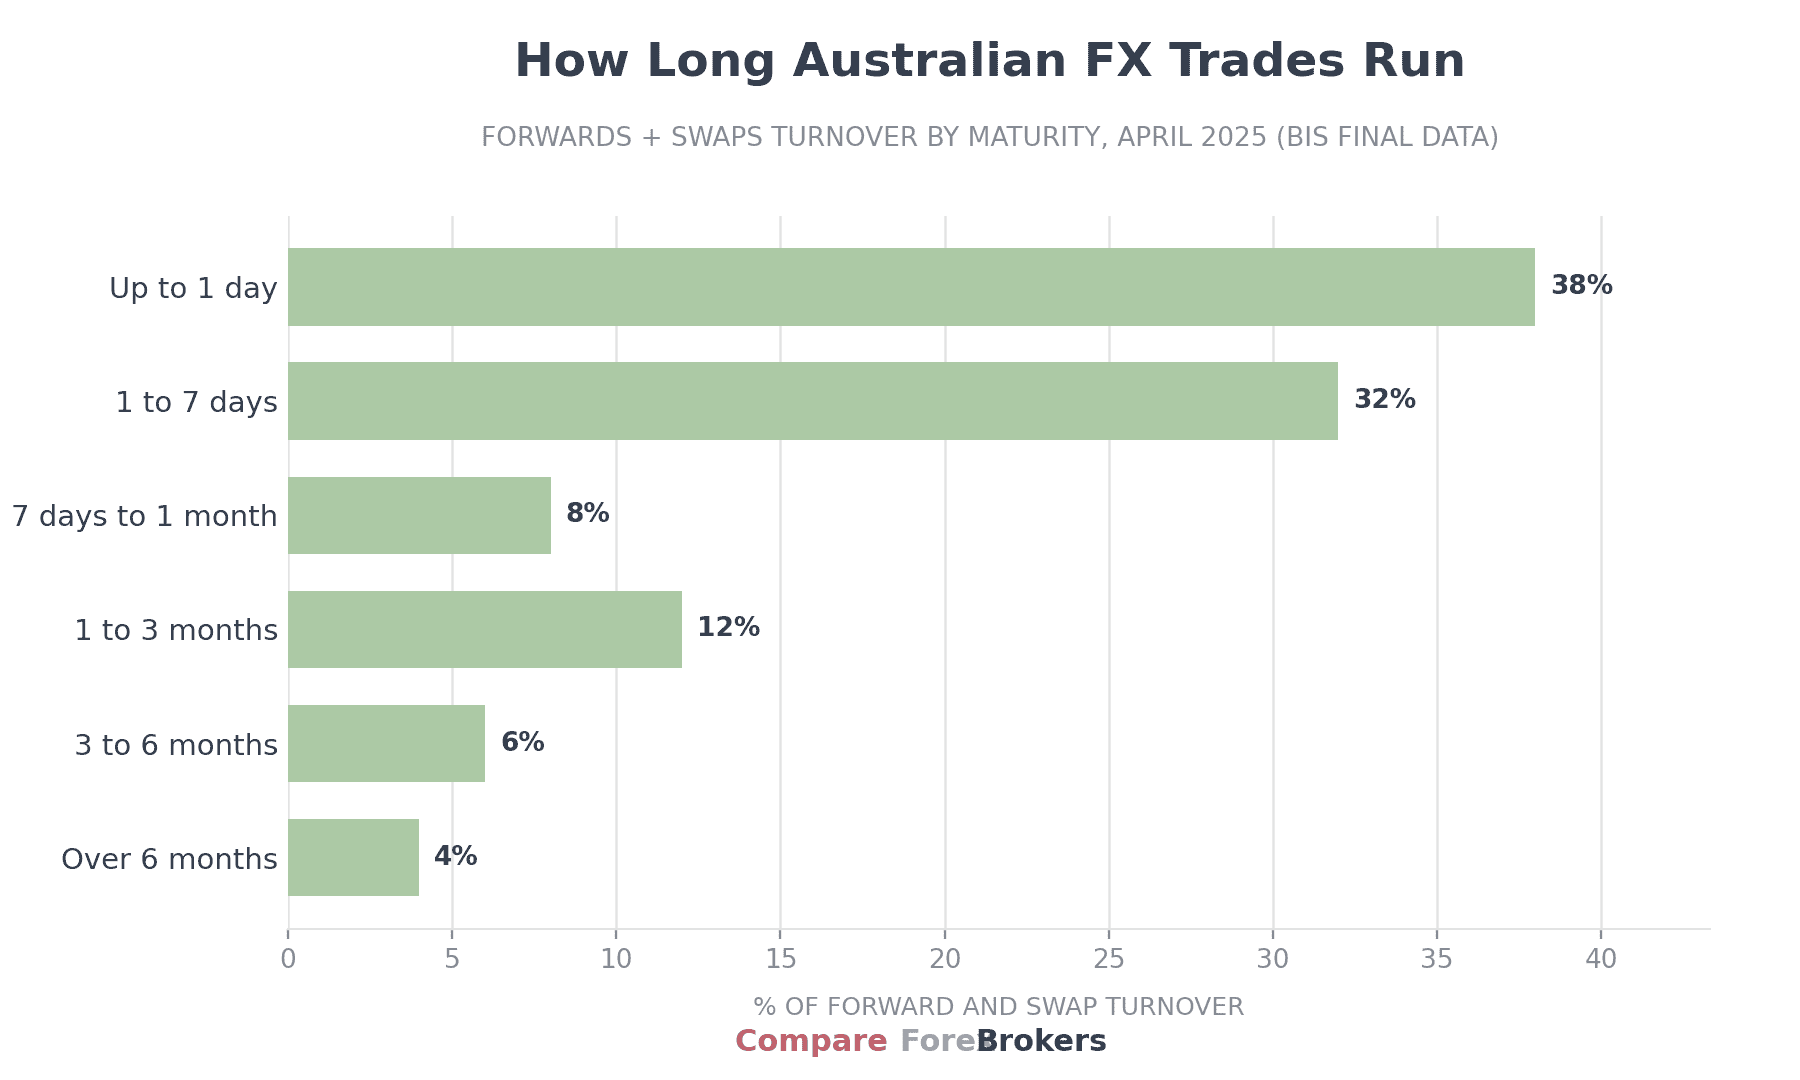
In 2025 most forex trading in Australia involved short-term deals that are closed by taking the opposite side of the trade (i.e. offset) :
Time taken for trades to be closed:
- Up to 1 day: 38%
- 1 to 7 days: 32%
- 7 days to 1 month: 8%
- 1 to 3 months: 12%
- 3 to 6 months: 6%
- Over 6 months: 4%
Almost three-quarters (73%) of Forex swaps last less than a week showing how Australian traders are focused on short-term liquidity compared to long-term positions.
Source: BIS Triennial Survey 2025, final revised data (June 2026)
Australia skews shorter than the global market: 38% of Australian forward and swap turnover matures within a day against roughly 25% globally, reflecting the dominance of overnight funding swaps in the local market.
73% of forex trades in Australia last less than a week which is shorter than the global average., Justin Grossbard
Retail Forex Trading In Australia
Retail-driven trades make up $2.4 billion a day, 1.2% of Australian turnover. ASIC’s product intervention order caps retail leverage at 30:1 on major pairs and 20:1 on minors, requires negative balance protection, and runs until 23 May 2027. Investment Trends’ November 2024 Australian Leverage Trading Report is the current industry census of local CFD and FX traders; IG cites it as the basis for its number one market position claim.
Note: Forex currency pairs and forex are used interchangeably throughout this article.
Sources
- BIS Triennial Central Bank Survey 2025
- Semi Annual Report On Australian Foreign Exchange Turnover
- CompareForexBrokers Annual Forex Volume Analysis
Bank for International Settlements (BIS)
The majority of the forex trading statistics referenced in this article are sourced from the Bank of International Settlements (BIS) Triennial Central Bank Survey 2025. The survey conducted by BIS is the largest global analysis of financial markets, focusing on OTC derivatives and currency markets.

Sources And Methodology
BIS Triennial Survey 2025, final revised dataset (June 2026 release): survey hub, final annex (PDF, June 2026), preliminary annex tables (XLSX, September 2025), preliminary summary tables (XLSX, September 2025). Additional sources: AFXC semi-annual FX turnover reports (April and October 2025), AFXC March 2025 meeting minutes (related-party trades), ASIC media release 22-095MR, Investment Trends Australian Leverage Trading Report (November 2024). Annualised figures on this page use 252 trading days.
About the author

Justin Grossbard is the Co-Founder and CEO of CompareForexBrokers, which he established with Noam Korbl in 2014. He has over 20 years of professional experience in online marketing and holds a Master's in Marketing from Monash University.
Our reviews are reader-supported. We may receive payment when you click a link to a partner site. Learn how we make money.