Our research team has conducted data-driven research of Australian stock market returns over the past two decades. It breaks down performance with and without dividends, compares results before and after inflation, and benchmarks the ASX200 against other major markets. All figures are based on credible data from trusted sources.
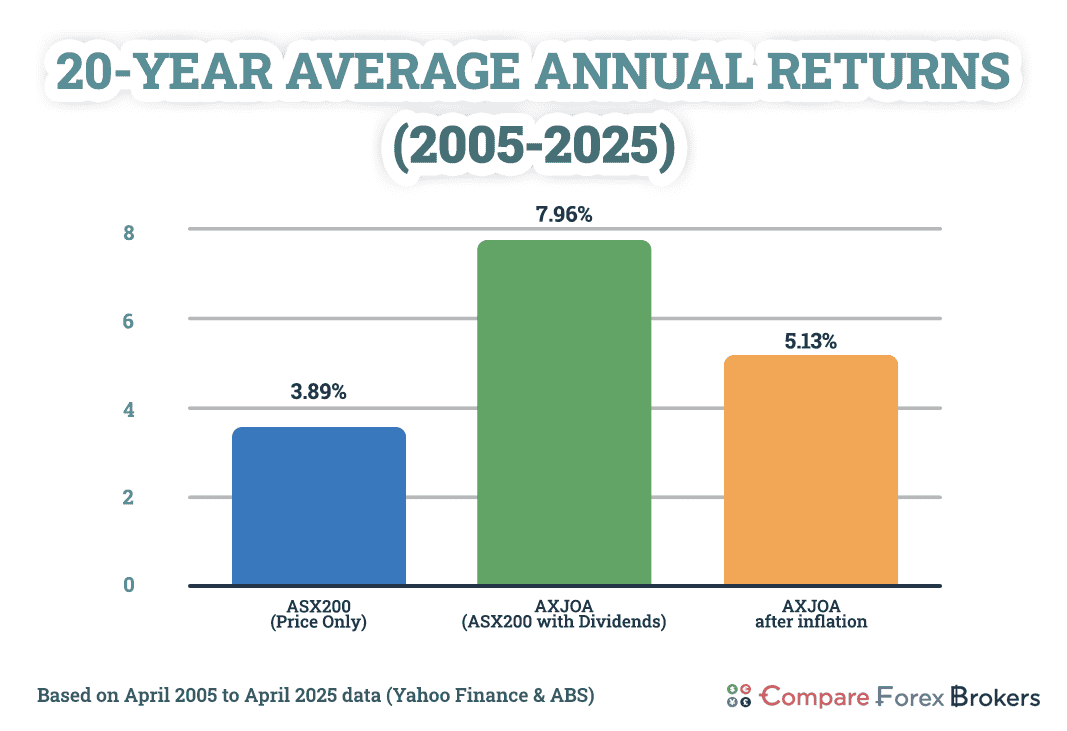
Over the last 20 years, the Australian stock market delivered an average return of 7.96% per year, but only if you reinvested all your dividends (AXJOA, Yahoo Finance). Without dividends, the index grew at just 3.89% annually, and after adjusting for inflation, the real return falls to 5.13% per year.
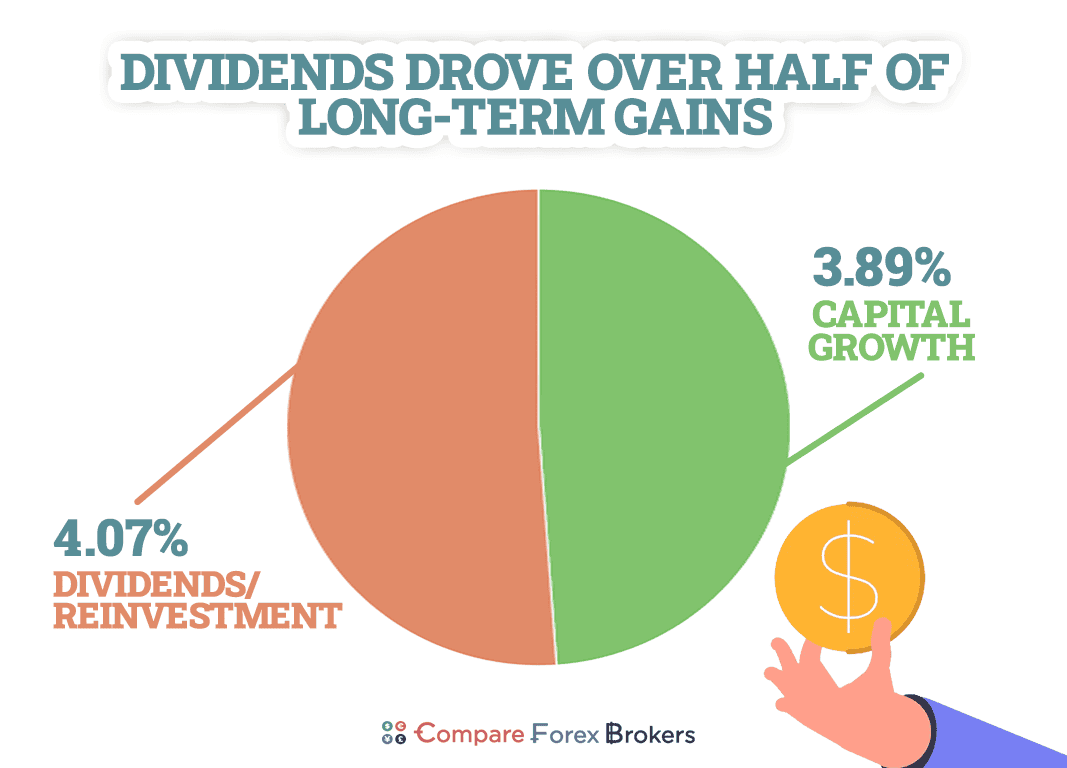
That gap between price-only and total returns, being more than 4% per year, is why long-term investors prioritise dividend reinvestment. In dollar terms, an investor who reinvested dividends since 2005 would have more than doubled their wealth compared to someone relying on price growth alone.
Over the past 20 years, term deposits earned just 3.35% per year, less than half the return of the ASX200 with dividends reinvested
What is the average stock market return?
Based on ASX200 index data from April 2005 to August 2025, the market delivered 3.89% per year in price growth alone. But that doesn’t tell the whole story because it leaves out inflation and dividends.
When you factor in dividends, the picture improves. The All Ordinaries Accumulation Index (AXJOA), which includes reinvested dividends, returned 5.02% between June 2024 and June 2025 (AXJOA, Yahoo Finance). Is should be factored in that over this period the Australian dollar decreased from US 69c to US 65c impacting true returns and Australian forex broker profitability.
Inflation chips away at both capital growth and reinvested dividends. Between 2005 and 2025, inflation averaged 2.74% per year in Australia (Consumer Price Index (CPI), ABS). Over the most recent 12-month return period for the AXJOA, inflation came in at 2.09%. That trimmed the index’s nominal return of 5.02% down to just 2.87% in real terms.
It’s a reminder that even a seemingly modest inflation rate can quietly halve the purchasing power of a portfolio’s annual gains.
Inflation erased nearly half the ASX200’s price gains between June 2024 and June 2025
Returns before and after inflation
Here’s a side-by-side comparison of stock market returns with and without dividends, and before and after inflation:
| Measurement Period | Return Type | Nominal Return | Inflation-Adjusted Return |
|---|---|---|---|
| Jun 2024 – Jun 2025 | ASX200 (Price Only) | 3.78% | 1.65% |
| Jun 2024 – Jun 2025 | AXJOA (With Dividends) | 5.02% | 2.87% |
Source: ASX200 and AXJOA (Yahoo Finance, Jun 2024 – Jun 2025); CPI (ABS, May 2025 release)
Inflation cut ASX200 price returns in half during 2024-2025, from 3.78% to just 1.65%
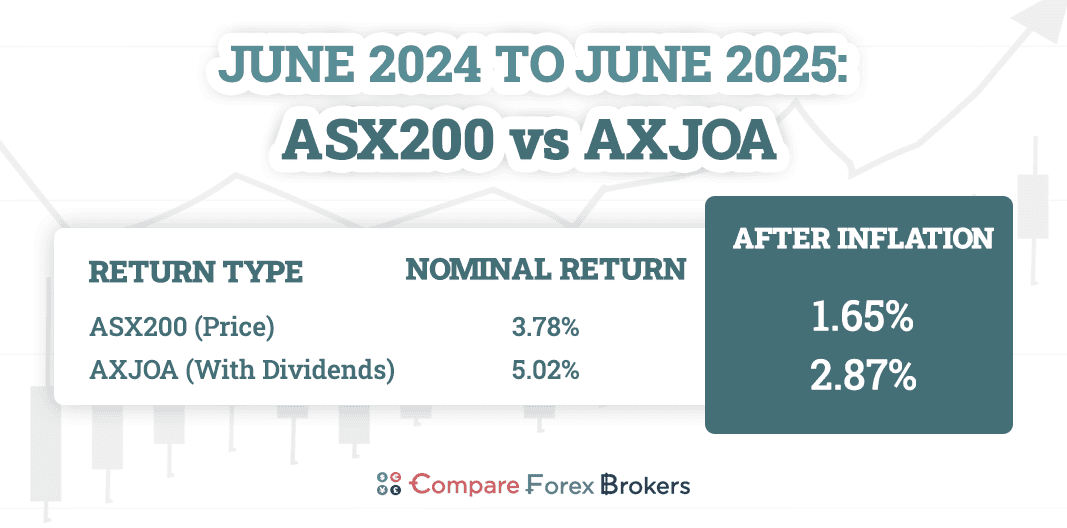
These figures are based on real market data. The ASX200 index grew from 7,876.7 to 8,174.2 between June 2024 and June 2025, a nominal return of 3.78%. After accounting for 2.09% inflation, the real return was 1.65%.
The AXJOA index, which includes dividends, rose from 99,808 to 104,815 over the same period. This gave a total return of 5.02%, or 2.87% after inflation.
This shows how much inflation can erode long-term gains, especially when dividends are excluded. It also highlights why most long-term investors rely on total return indexes and reinvest their dividends, to grow wealth over time.
Why we use CAGR
The returns here are expressed as compound annual growth rates (CAGR), which smooth out short-term ups and downs to show the average yearly growth over a set period. It’s a more realistic measure than just taking the average of each year’s return, because it accounts for the compounding effect, losses in one year drag down the gains in future years.
The ASX200 delivered 5.02% with dividends in the year to June 2025, but inflation wiped out nearly half the gain, leaving just 2.87% in real terms
ASX200 Returns Over Time
The long-term performance of the Australian stock market has rewarded patient investors, especially those reinvesting dividends. Using internal data from the All Ordinaries Accumulation Index (AXJOA), which includes both capital gains and dividends, we can calculate how the ASX200 has performed through various economic cycles from April 2005 to April 2025.
Long-term average returns are 7.96% per year
Over the past 20 years, the AXJOA index grew from 22,664 to 104,815 points. That represents a compound annual growth rate (CAGR) of 7.96% per year. We favour CAGR over simple averaging because it accounts for compounding and provides a more accurate picture of long-term investor experience.
Without dividends, the price index alone (ASX200) returned just 3.89% annually over the same period. The gap between those figures (more than 4% per year) is entirely due to dividend reinvestment.
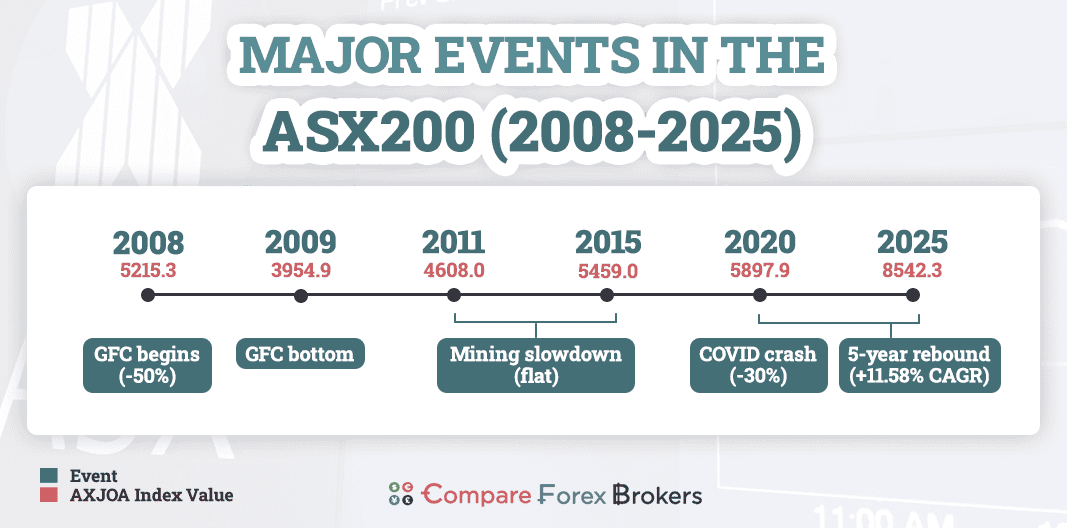
Key boom and bust periods
Market growth over the past 20 years has not been linear. The following periods show how short-term shocks can impact long-term outcomes:
- Global Financial Crisis (2008-2009): A severe drawdown erased over half of the ASX200’s value. Investors who stayed invested waited years to break even on capital gains, but reinvested dividends softened the blow and helped restore value faster than the headline index suggests.
- Post-mining boom slowdown (2011-2015): This period saw muted returns as falling commodity prices and political volatility dampened earnings and investor sentiment. Despite this, the AXJOA continued compounding thanks to consistent dividend flows from large-cap stocks.
- COVID crash and rebound (2020-2021): In just four weeks, the ASX200 lost more than 30% of its value. But the recovery was equally sharp. Massive fiscal stimulus, interest rate cuts, and increased household savings drove one of the fastest recoveries in ASX history. From April 2020 onward, the index entered one of its strongest five-year runs.
- The 2020s rally (2020-2025): This period delivered an average annual return of 11.58%, one of the most aggressive growth phases in two decades. That includes the COVID rebound but also reflects global growth momentum, strong performance from tech and mining, and the persistent inflow of retirement savings via superannuation.
During the 2008-09 GFC crash, ASX‑200 lost over 50% but recovered faster for reinvested dividend holders
Investors who stayed invested through the COVID crash earned over 11% per year over the next five years.
During the 2008-09 GFC crash, ASX‑200 lost over 50% but recovered faster for reinvested dividend holders
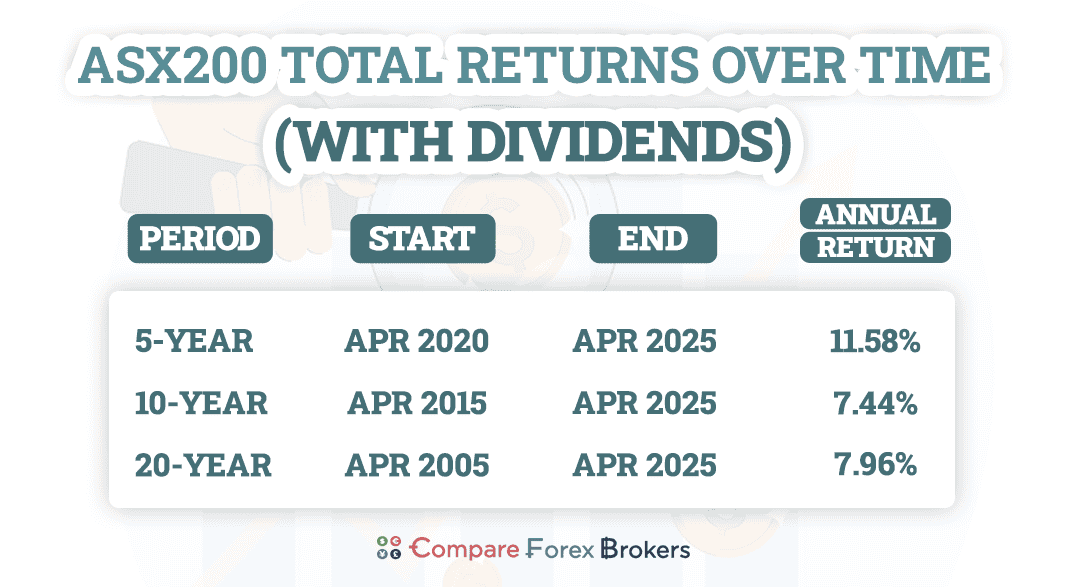
5-Year, 10-Year, 20-Year ASX200 Returns
We’ve broken down total returns (including dividends) across three investment horizons to show how performance changes over time:
| Time Period | Start Date | End Date | CAGR (Nominal) |
|---|---|---|---|
| 5-Year | Apr 2020 | Apr 2025 | 11.58% |
| 10-Year | Apr 2015 | Apr 2025 | 7.44% |
| 20-Year | Apr 2005 | Apr 2025 | 7.96% |
Source: AXJOA (Yahoo Finance, Apr 2005 – Apr 2025)
These figures are based on monthly AXJOA index levels and calculated using CAGR. All returns assume full dividend reinvestment and exclude tax.
A $10,000 term deposit in 2005 earning 3.35% would now be just ~$18,500 whereas the same $10,000 in ASX200 total returns is around $45,000
Average ASX200 Returns
The 5-year figure of 11.58% includes both the sharp COVID drawdown and the recovery that followed. It’s a reminder of how quickly markets can rebound, and why missing just a few good months can distort long-term results.
The 10-year return of 7.44% captures a more balanced cycle. It includes the slow-growth years before COVID and the rebound that followed. This range is often seen as a fair proxy for a full economic cycle.
The 20-year figure of 7.96% provides the cleanest benchmark. It includes the GFC, multiple federal election cycles, commodity supercycles, and the low-rate environment of the 2010s. This is the number long-term investors can reasonably use as a reference point for total market performance in Australia.
Inflation-adjusted context
Over these periods, inflation averaged between 2.5% and 2.8% per year (CPI, RBA & ABS, 2005 – 2025). That means real returns, the growth in purchasing power, were:
- Around 9% nominal becomes 6% real over 5 years
- Around 8% nominal becomes 5% to 5.5% real over 10 and 20 years
These returns are well above inflation and outpace most other passive investments. They also highlight why dividends matter so much in the Australian market, where many top-50 companies offer high, fully franked yields. The also don’t impact brokerage which can add up hence we have our low spread broker comparison page.
Australia vs New Zealand Stock Market Returns
 Comparing Australia’s ASX200 with New Zealand’s NZX50 shows just how differently the two markets have performed over time. The contrast is especially clear when we look at long-term price returns, excluding dividends, across the same time periods.
This table shows the average annual return for both indices across 1, 5, 10, 15, and 20-year timeframes. These are price-only returns and do not include dividends. Inflation-adjusted returns use Australia’s CPI average of 2.74% per year, applied consistently across both markets.
ASX200 vs NZX50 Price Returns (Nominal and Real)
| Time Period | Data Range | ASX200 (Nominal) | ASX200 Inflation Rate (AU) | ASX200 (Real) | NZX50 (Nominal) | NZX Inflation Rate (NZ) | NZX50 (Real) |
|---|---|---|---|---|---|---|---|
| 1-Year | Apr 2024 – Apr 2025 | 6.03% | 2.82% | 3.21% | 0.39% | 2.67% | –2.28% |
| 5-Year | Apr 2020 – Apr 2025 | 8.03% | 2.88% | 5.15% | 0.08% | 2.72% | –2.59% |
| 10-Year | Apr 2015 – Apr 2025 | 3.56% | 2.76% | 0.80% | 0.03% | 2.67% | –2.64% |
| 15-Year | Apr 2010 – Apr 2025 | 3.45% | 2.76% | 0.69% | 0.04% | 2.66% | –2.63% |
| 20-Year | Apr 2005 – Apr 2025 | 3.63% | 2.74% | 0.87% | 0.02% | 2.67% | –2.65% |
Sources:
- Yahoo Finance. (2025, August). S&P/ASX 200 (^AXJO) Historical Data. April 2005 – April 2025
- Yahoo Finance. (2025, August). S&P/NZX 50 INDEX GROSS (^NZ50) Historical Data. April 2005 – April 2025
- Australian Bureau of Statistics. (2025, June). All Groups CPI, Australia. April 2005 – April 2025
- Reserve Bank of Australia. (2025, July). Measures of Consumer Price Inflation.
- Stats NZ. (2025). Consumers Price Index (CPI), New Zealand. April 2005 – April 2025
The ASX200 returned 8.03% per year over the last five years, even before dividends
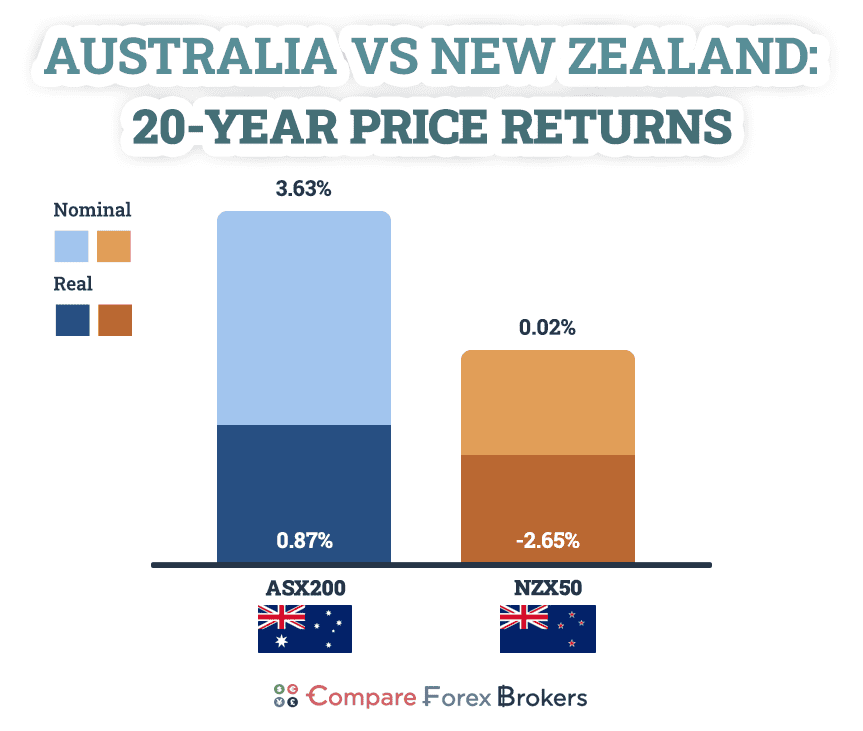
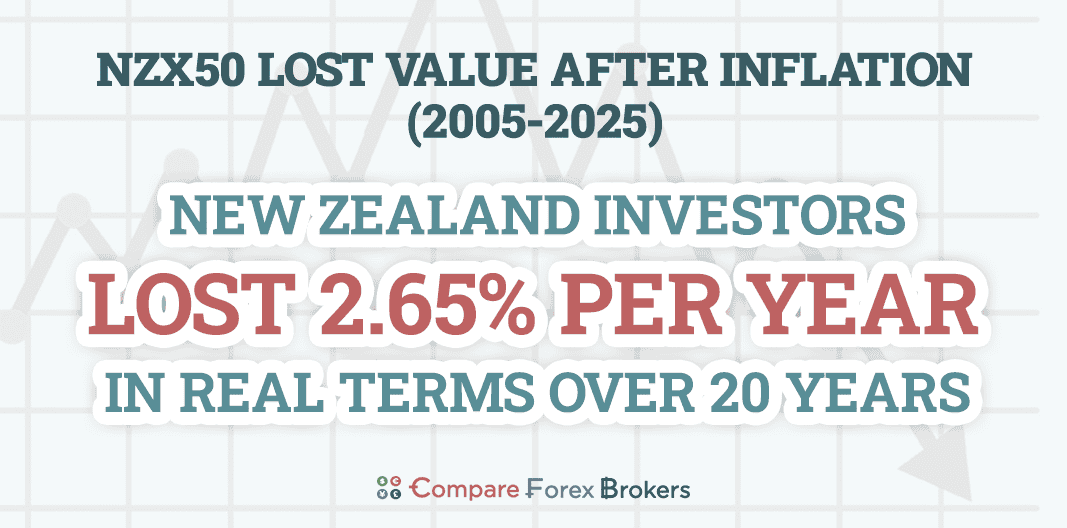
After inflation, New Zealand investors lost 2.65% per year in capital value over two decades
Why has Australia outperformed?
Beyond index composition and economic exposure, tax and dividend policy also shape outcomes for long-term investors.
New Zealand investors lost value in real terms every year for two decades, even before fees or taxes
Dividends and tax treatment
Australian companies tend to pay higher dividends than New Zealand counterparts, particularly in banking, resources, and infrastructure sectors. But more importantly, Australian investors benefit from franking credits, a tax system that avoids double-taxing dividends. These credits reduce or eliminate the tax payable on dividend income, especially for retirees and lower-income investors.
Franking credits give Australian investors a tax advantage no other market offers
New Zealand offers a similar system called imputation credits, but the structure is narrower and less favourable, particularly for international shareholders. NZX-listed firms also tend to retain more earnings or pay out smaller proportions, which limits the role of dividends in long-term wealth accumulation.
Australian investors often receive 4% to 6% per year in grossed-up dividends from ASX200 stocks
Market exposure and investment flows
- The ASX200 is more diversified by sector and size, with exposure to global commodity markets, domestic financials, and international-facing firms.
- The NZX50 is smaller and more concentrated, with a tilt toward low-growth, defensive sectors that underperform during inflationary cycles.
The result is a clear pattern: Australia provides more growth and higher income, while New Zealand has offered lower volatility but significantly lower real returns.
Franking credits frequently mean retirees pay little to no tax on dividend income
Australia vs USA Stock Market Returns
Over the long term, the United States has outperformed Australia in total stock market returns. This isn’t just due to short-term market cycles. It’s structural. The differences in sector weightings, capital reinvestment strategies, and investor behaviour have consistently favoured the U.S. over multi-decade timeframes.
The S&P 500 delivered more than double the ASX200’s real return over the past 10 years.
The table below compares total return figures (including dividends) for both the Australian and U.S. stock markets over matched time periods ending in April 2025.
Total Returns: ASX200 vs S&P 500 (Including Dividends)
| Time Period | Data Range | ASX200 (Nominal) | ASX200 (Real) | S&P 500 (Nominal) | S&P 500 (Real) |
|---|---|---|---|---|---|
| 1-Year Average Return | Apr 2024 – Apr 2025 | 5.75% | 3.55% | 12.10% | 9.29% |
| 5-Year Average Return | Apr 2020 – Apr 2025 | 11.58% | 8.65% | 15.61% | 12.70% |
| 10-Year Average Return | Apr 2015 – Apr 2025 | 7.44% | 4.57% | 12.32% | 9.49% |
| 20-Year Average Return | Apr 2005 – Apr 2025 | 7.96% | 5.13% | 10.30% | 7.53% |
All figures were calculated using compound annual growth rates (CAGR) and adjusted for inflation based on each country’s CPI data.
Sources:
- AXJOA, Yahoo Finance, Apr 2005 – Apr 2025
- SPXTR, Yahoo Finance, Apr 2005 – Apr 2025
- CPI-U, BLS, 2005 – 2025
Methodology
When conducting our research and analysis, all data was taken from publicly available sources, and calculations were based on transparent, repeatable formulas. Index values were drawn from Yahoo Finance, while inflation data came from national statistics agencies.
Source Data
All data used in this report comes from authoritative and publicly trusted sources:
- Stock index data was obtained from Yahoo Finance in August 2025. This includes the S&P/ASX 200 Index (AXJO), the All Ordinaries Accumulation Index (AXJOA), the S&P/NZX 50 Index (NZ50), and the S&P 500 Total Return Index (SPXTR).
- Inflation figures were drawn from official statistics bureaus in each country: the Australian Bureau of Statistics (ABS), Stats NZ, and the U.S. Bureau of Labor Statistics (BLS). Additional trend data was validated against Reserve Bank of Australia (RBA) CPI series.
Return Calculations
To measure average growth over time, we used compound annual growth rates (CAGR). This method reflects the impact of compounding and is more accurate than simply averaging yearly returns.
The formula used was:
CAGR = (Ending Value / Starting Value) ^ (1 / n) – 1
where n is the number of years
All long-term return periods begin in April (e.g. April 2005 to April 2025), using monthly index data to minimise distortions from short-term volatility.
One-year returns use the most recent full period available: June 2024 to June 2025.
This approach was applied across all markets to ensure consistent comparisons.
Inflation Adjustment
To show the real growth in purchasing power, all nominal returns were adjusted for inflation using country-specific CPI data. The formula used was:
Real Return = (1 + Nominal Return) / (1 + Inflation Rate) – 1
For example, if nominal CAGR was 8.03% and inflation averaged 2.88%, the real return would be:
(1.0803 / 1.0288) – 1 = 5.15%
CPI data was matched precisely to each measurement period. For one-year returns, we used the May 2025 CPI release to estimate inflation from June 2024 to June 2025.
This ensured that real returns reflect actual changes in purchasing power.
Dividend Treatment and Index Types
Where available, we used total return indexes that assume dividends are fully reinvested. This gives a more accurate view of long-term investment outcomes.
- AXJOA includes dividends for the Australian market
- SPXTR includes dividends for the U.S.
- NZX50 is a price-only index and does not include dividends
Because NZX50 lacks total return data, comparisons between Australia and New Zealand use price-only figures. In contrast, comparisons between Australia and the U.S. use total return indexes to reflect full investor outcomes.
All Australian data was shown both with and without dividends to highlight the impact of reinvestment over time.
Comparison Controls
To ensure fair comparisons across countries and time periods:
- We aligned start and end dates for every return window (1, 5, 10, 15, and 20 years)
- We matched index types: total return vs total return, price-only vs price-only
- We used each country’s own CPI data to calculate real returns
This method avoids distortions caused by inconsistent benchmarks, misaligned timeframes, or generic inflation adjustments.
Assumptions and Limitations
Several assumptions were necessary:
- Total return indexes (AXJOA, SPXTR) assume continuous dividend reinvestment but don’t specify yields or payment schedules
- NZX50 excludes dividends entirely, which underreports long-term investor outcomes
- CPI figures for late 2025 may be revised, though they reflect the latest available data as of August 2025
- All returns are in local currency; cross-border taxes and currency impacts are not included
Despite these limitations, all methods used are standard for long-term investment performance analysis and are fully transparent for replication.
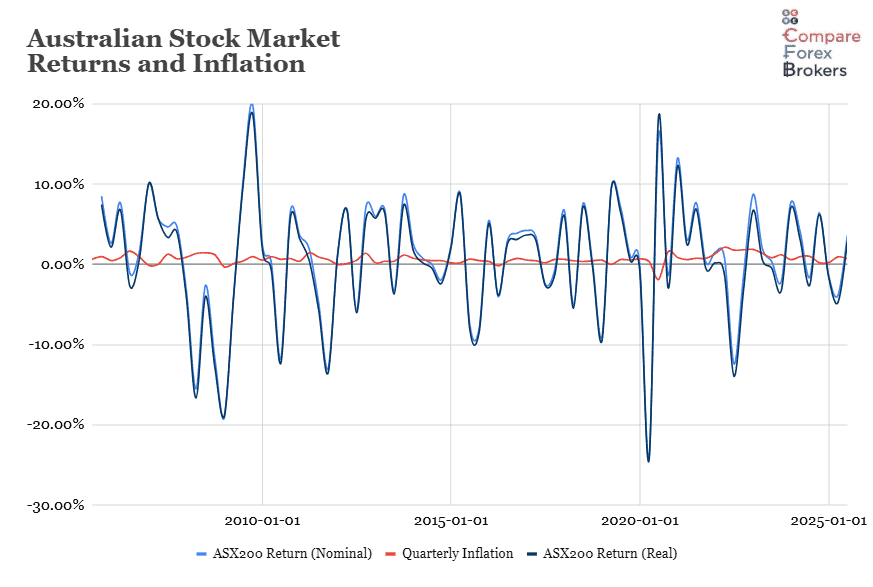
Raw Data
| Date | ASX200 (Nominal) | AXJOA (Nominal) | Quarterly CPI | ASX200 Return (Nominal) | AXJOA Return (Nominal) | Quarterly Inflation | ASX200 Return (Real) | AXJOA Return (Real) |
|---|---|---|---|---|---|---|---|---|
| 30/06/2005 | 4277.5 | 24533.9 | 82.6 | 0.61% | ||||
| 30/09/2005 | 4641.2 | 26982.3 | 83.4 | 8.50% | 9.98% | 0.97% | 7.46% | 8.92% |
| 31/12/2005 | 4763.4 | 27943.1 | 83.8 | 2.63% | 3.56% | 0.48% | 2.14% | 3.07% |
| 31/03/2006 | 5129.7 | 30466.6 | 84.5 | 7.69% | 9.03% | 0.84% | 6.80% | 8.13% |
| 30/06/2006 | 5073.9 | 30405.1 | 85.9 | -1.09% | -0.20% | 1.66% | -2.70% | -1.83% |
| 30/09/2006 | 5154.1 | 31288.2 | 86.7 | 1.58% | 2.90% | 0.93% | 0.64% | 1.95% |
| 31/12/2006 | 5669.9 | 34711.4 | 86.6 | 10.01% | 10.94% | -0.12% | 10.13% | 11.07% |
| 31/03/2007 | 5995 | 37103.5 | 86.6 | 5.73% | 6.89% | 0.00% | 5.73% | 6.89% |
| 30/06/2007 | 6274.9 | 39119.1 | 87.7 | 4.67% | 5.43% | 1.27% | 3.36% | 4.11% |
| 30/09/2007 | 6567.8 | 41424.1 | 88.3 | 4.67% | 5.89% | 0.68% | 3.96% | 5.17% |
| 31/12/2007 | 6339.8 | 40291.2 | 89.1 | -3.47% | -2.73% | 0.91% | -4.34% | -3.61% |
| 31/03/2008 | 5355.7 | 34491.9 | 90.3 | -15.52% | -14.39% | 1.35% | -16.65% | -15.53% |
| 30/06/2008 | 5215.3 | 33875.3 | 91.6 | -2.62% | -1.79% | 1.44% | -4.00% | -3.18% |
| 30/09/2008 | 4600.5 | 30338.8 | 92.7 | -11.79% | -10.44% | 1.20% | -12.84% | -11.50% |
| 31/12/2008 | 3722.3 | 24801.3 | 92.4 | -19.09% | -18.25% | -0.32% | -18.83% | -17.99% |
| 31/03/2009 | 3582.1 | 24310.04 | 92.5 | -3.77% | -1.98% | 0.11% | -3.87% | -2.09% |
| 30/06/2009 | 3954.9 | 27053.61 | 92.9 | 10.41% | 11.29% | 0.43% | 9.93% | 10.81% |
| 30/09/2009 | 4743.6 | 32870.39 | 93.8 | 19.94% | 21.50% | 0.97% | 18.79% | 20.34% |
| 31/12/2009 | 4870.6 | 33985.86 | 94.3 | 2.68% | 3.39% | 0.53% | 2.13% | 2.85% |
| 31/03/2010 | 4875.5 | 34448.55 | 95.2 | 0.10% | 1.36% | 0.95% | -0.85% | 0.40% |
| 30/06/2010 | 4301.5 | 30609.97 | 95.8 | -11.77% | -11.14% | 0.63% | -12.33% | -11.70% |
| 30/09/2010 | 4582.9 | 33069.97 | 96.5 | 6.54% | 8.04% | 0.73% | 5.77% | 7.25% |
| 31/12/2010 | 4745.2 | 34518.54 | 96.9 | 3.54% | 4.38% | 0.41% | 3.11% | 3.95% |
| 31/03/2011 | 4837.9 | 35632.05 | 98.3 | 1.95% | 3.23% | 1.44% | 0.50% | 1.76% |
| 30/06/2011 | 4608 | 34200.68 | 99.2 | -4.75% | -4.02% | 0.92% | -5.62% | -4.89% |
| 30/09/2011 | 4008.6 | 30239.41 | 99.8 | -13.01% | -11.58% | 0.60% | -13.53% | -12.11% |
| 31/12/2011 | 4056.6 | 30879.12 | 99.8 | 1.20% | 2.12% | 0.00% | 1.20% | 2.12% |
| 31/03/2012 | 4335.2 | 33472.33 | 99.9 | 6.87% | 8.40% | 0.10% | 6.76% | 8.29% |
| 30/06/2012 | 4094.6 | 31904.52 | 100.4 | -5.55% | -4.68% | 0.50% | -6.02% | -5.16% |
| 30/09/2012 | 4387 | 34723.66 | 101.8 | 7.14% | 8.84% | 1.39% | 5.67% | 7.34% |
| 31/12/2012 | 4649 | 37134.53 | 102 | 5.97% | 6.94% | 0.20% | 5.76% | 6.73% |
| 31/03/2013 | 4966.5 | 40160.92 | 102.4 | 6.83% | 8.15% | 0.39% | 6.41% | 7.73% |
| 30/06/2013 | 4802.6 | 39163.27 | 102.8 | -3.30% | -2.48% | 0.39% | -3.68% | -2.86% |
| 30/09/2013 | 5218.9 | 43157.87 | 104 | 8.67% | 10.20% | 1.17% | 7.41% | 8.93% |
| 31/12/2013 | 5352.2 | 44635.11 | 104.8 | 2.55% | 3.42% | 0.77% | 1.77% | 2.63% |
| 31/03/2014 | 5394.8 | 45567.84 | 105.4 | 0.80% | 2.09% | 0.57% | 0.22% | 1.51% |
| 30/06/2014 | 5395.7 | 45991.23 | 105.9 | 0.02% | 0.93% | 0.47% | -0.46% | 0.45% |
| 30/09/2014 | 5292.8 | 45716.65 | 106.4 | -1.91% | -0.60% | 0.47% | -2.37% | -1.06% |
| 31/12/2014 | 5411 | 47139.24 | 106.6 | 2.23% | 3.11% | 0.19% | 2.04% | 2.92% |
| 31/03/2015 | 5891.5 | 52006.71 | 106.8 | 8.88% | 10.33% | 0.19% | 8.68% | 10.12% |
| 30/06/2015 | 5459 | 48602.26 | 107.5 | -7.34% | -6.55% | 0.66% | -7.94% | -7.15% |
| 30/09/2015 | 5021.6 | 45404.89 | 108 | -8.01% | -6.58% | 0.47% | -8.44% | -7.01% |
| 31/12/2015 | 5295.9 | 48346.39 | 108.4 | 5.46% | 6.48% | 0.37% | 5.07% | 6.09% |
| 31/03/2016 | 5082.8 | 47018.56 | 108.2 | -4.02% | -2.75% | -0.18% | -3.85% | -2.57% |
| 30/06/2016 | 5233.4 | 48872.37 | 108.6 | 2.96% | 3.94% | 0.37% | 2.58% | 3.56% |
| 30/09/2016 | 5435.9 | 51386.01 | 109.4 | 3.87% | 5.14% | 0.74% | 3.11% | 4.37% |
| 31/12/2016 | 5665.8 | 54049.93 | 110 | 4.23% | 5.18% | 0.55% | 3.66% | 4.61% |
| 31/03/2017 | 5864.9 | 56652.87 | 110.5 | 3.51% | 4.82% | 0.45% | 3.05% | 4.34% |
| 30/06/2017 | 5721.5 | 55758.56 | 110.7 | -2.45% | -1.58% | 0.18% | -2.62% | -1.76% |
| 30/09/2017 | 5681.6 | 56137.99 | 111.4 | -0.70% | 0.68% | 0.63% | -1.32% | 0.05% |
| 31/12/2017 | 6065.1 | 60425.7 | 112.1 | 6.75% | 7.64% | 0.63% | 6.08% | 6.97% |
| 31/03/2018 | 5759.4 | 58092.5 | 112.6 | -5.04% | -3.86% | 0.45% | -5.46% | -4.29% |
| 30/06/2018 | 6194.6 | 63015.41 | 113 | 7.56% | 8.47% | 0.36% | 7.18% | 8.09% |
| 30/09/2018 | 6207.6 | 63979.04 | 113.5 | 0.21% | 1.53% | 0.44% | -0.23% | 1.08% |
| 31/12/2018 | 5646.4 | 58709.8 | 114.1 | -9.04% | -8.24% | 0.53% | -9.52% | -8.72% |
| 31/03/2019 | 6180.7 | 65101.27 | 114.1 | 9.46% | 10.89% | 0.00% | 9.46% | 10.89% |
| 30/06/2019 | 6618.8 | 70291.79 | 114.8 | 7.09% | 7.97% | 0.61% | 6.44% | 7.31% |
| 30/09/2019 | 6688.3 | 71954.54 | 115.4 | 1.05% | 2.37% | 0.52% | 0.52% | 1.83% |
| 31/12/2019 | 6684.1 | 72445.03 | 116.2 | -0.06% | 0.68% | 0.69% | -0.75% | -0.01% |
| 31/03/2020 | 5076.8 | 55711.41 | 116.6 | -24.05% | -23.10% | 0.34% | -24.31% | -23.36% |
| 30/06/2020 | 5897.9 | 64892.86 | 114.4 | 16.17% | 16.48% | -1.89% | 18.41% | 18.72% |
| 30/09/2020 | 5815.9 | 64608.07 | 116.2 | -1.39% | -0.44% | 1.57% | -2.92% | -1.98% |
| 31/12/2020 | 6587.1 | 73459.59 | 117.2 | 13.26% | 13.70% | 0.86% | 12.29% | 12.73% |
| 31/03/2021 | 6790.7 | 76585.7 | 117.9 | 3.09% | 4.26% | 0.60% | 2.48% | 3.64% |
| 30/06/2021 | 7313 | 82932.29 | 118.8 | 7.69% | 8.29% | 0.76% | 6.88% | 7.47% |
| 30/09/2021 | 7332.2 | 84351.55 | 119.7 | 0.26% | 1.71% | 0.76% | -0.49% | 0.95% |
| 31/12/2021 | 7444.6 | 86117.72 | 121.3 | 1.53% | 2.09% | 1.34% | 0.19% | 0.75% |
| 31/03/2022 | 7499.6 | 88049.03 | 123.9 | 0.74% | 2.24% | 2.14% | -1.38% | 0.10% |
| 30/06/2022 | 6568.1 | 77568.63 | 126.1 | -12.42% | -11.90% | 1.78% | -13.95% | -13.44% |
| 30/09/2022 | 6474.2 | 77868.43 | 128.4 | -1.43% | 0.39% | 1.82% | -3.20% | -1.41% |
| 31/12/2022 | 7038.7 | 85188.04 | 130.8 | 8.72% | 9.40% | 1.87% | 6.72% | 7.39% |
| 31/03/2023 | 7177.8 | 88137.9 | 132.6 | 1.98% | 3.46% | 1.38% | 0.59% | 2.06% |
| 30/06/2023 | 7203.3 | 89031.72 | 133.7 | 0.36% | 1.01% | 0.83% | -0.47% | 0.18% |
| 30/09/2023 | 7048.6 | 88349.68 | 135.3 | -2.15% | -0.77% | 1.20% | -3.30% | -1.94% |
| 31/12/2023 | 7590.8 | 95767.32 | 136.1 | 7.69% | 8.40% | 0.59% | 7.06% | 7.76% |
| 31/03/2024 | 7896.9 | 100869.63 | 137.4 | 4.03% | 5.33% | 0.96% | 3.05% | 4.33% |
| 30/06/2024 | 7767.5 | 99807.75 | 138.8 | -1.64% | -1.05% | 1.02% | -2.63% | -2.05% |
| 30/09/2024 | 8269.8 | 107579.05 | 139.1 | 6.47% | 7.79% | 0.22% | 6.24% | 7.55% |
| 31/12/2024 | 8159.1 | 106723.29 | 139.4 | -1.34% | -0.80% | 0.22% | -1.55% | -1.01% |
| 31/03/2025 | 7843.4 | 103733.5 | 140.7 | -3.87% | -2.80% | 0.93% | -4.76% | -3.70% |
| 30/06/2025 | 8126.2 | 104814.55 | 141.7 | 3.61% | 1.04% | 0.71% | 2.87% | 0.33% |
Sources:
- Reserve Bank of Australia. (2025, July). Measures of Consumer Price Inflation.
- Australian Bureau of Statistics. (2025, June). Monthly Consumer Price Index Indicator, May 2025.
- Australian Bureau of Statistics. (2025, June). All Groups CPI, Australia, Quarterly and Annual Movements.
- Australian Bureau of Statistics. (2025, August). Monthly and Quarterly Data Series: Complete Monthly Measure of CPI.
- Australian Taxation Office. (2025, August). Consumer Price Index (CPI) rates.
- U.S. Bureau of Labor Statistics. (2025). Consumer Price Index – USA City Average.
- Yahoo Finance. (2025). S&P/ASX 200 (^AXJO) Historical Data.
- Yahoo Finance. (2025). ALL ORDINARIES (^AORD / AXJOA) Historical Data.
- Yahoo Finance. (2025). S&P/NZX 50 INDEX GROSS (^NZ50) Historical Data.
- Yahoo Finance. (2025). S&P 500 Index (^GSPC) Historical Data.
- Yahoo Finance. (2025). S&P 500 Total Return Index (SPXTR) Historical Data.
If you are interested in other industry analysis and market data, read our latest reports on The Real Cost of Bitcoin Mining, or The Most Expensive Airbnbs in the UK.