Introduction to Bearish Trading
The great thing about forex trading is that you can make money when the markets are going down – otherwise known as shorting. Bearish candlestick patterns are specific formations on price charts that signal potential downward price movements or reversals from uptrends to downtrends. These patterns help traders looking to capitalise on bearish market conditions.
Let me start with a truth every forex trader learns the hard way: bullish markets are where money is made, but bearish markets are where wealth is preserved. If you trade forex for a living, mastering both bullish and bearish markets is crucial.
Catching a bearish trend reversal early allows you to profit from panic, greed, and the snowballing sentiment that drives markets. Over my 12 years of trading currencies, I’ve found that bearish reversal candlestick patterns, such as the bearish engulfing pattern or the double top, are among the most reliable indicators for identifying potential downtrends.
Why Understanding Individual Candlesticks Comes First
Candlesticks are there and tell us a story of the tug of war that took place, and who won. They cut through the noise and show you the raw battle between buyers and sellers. Here’s what I focus on:
- Opening and closing prices: A bullish candle closing at its high shows confidence; a bearish candle closing near its low reveals fear.
- Wicks and shadows: A long upper wick on a shooting star candlestick pattern? That’s buyers failing to hold ground.
- Candle Body Size: The more selling or buying inside a candle, the larger the volatility – reflected in its body size. Engulfing red candles are key in bearish trading.
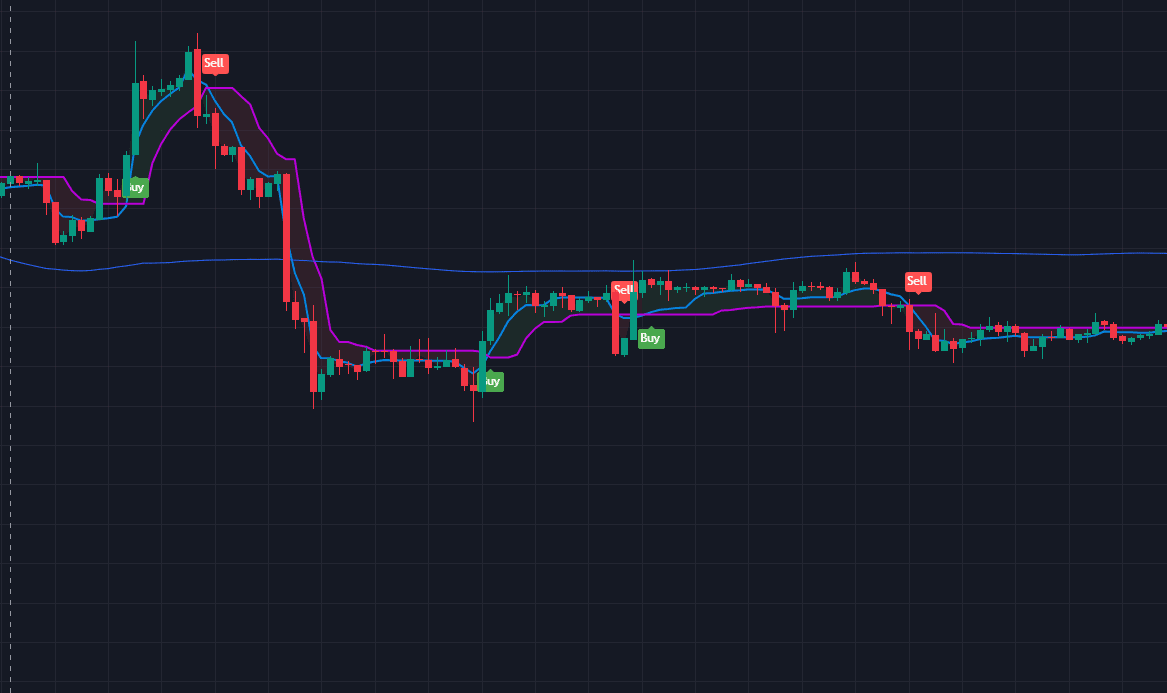
Bearish Candlestick Patterns
Now that you know about chart patterns, it’s also important to read individual candles—critical in the fast-moving forex market. Below, I dissect the five bearish reversal candlestick patterns I’ve relied on for my trading career, sharing exact strategies to trade them profitably.
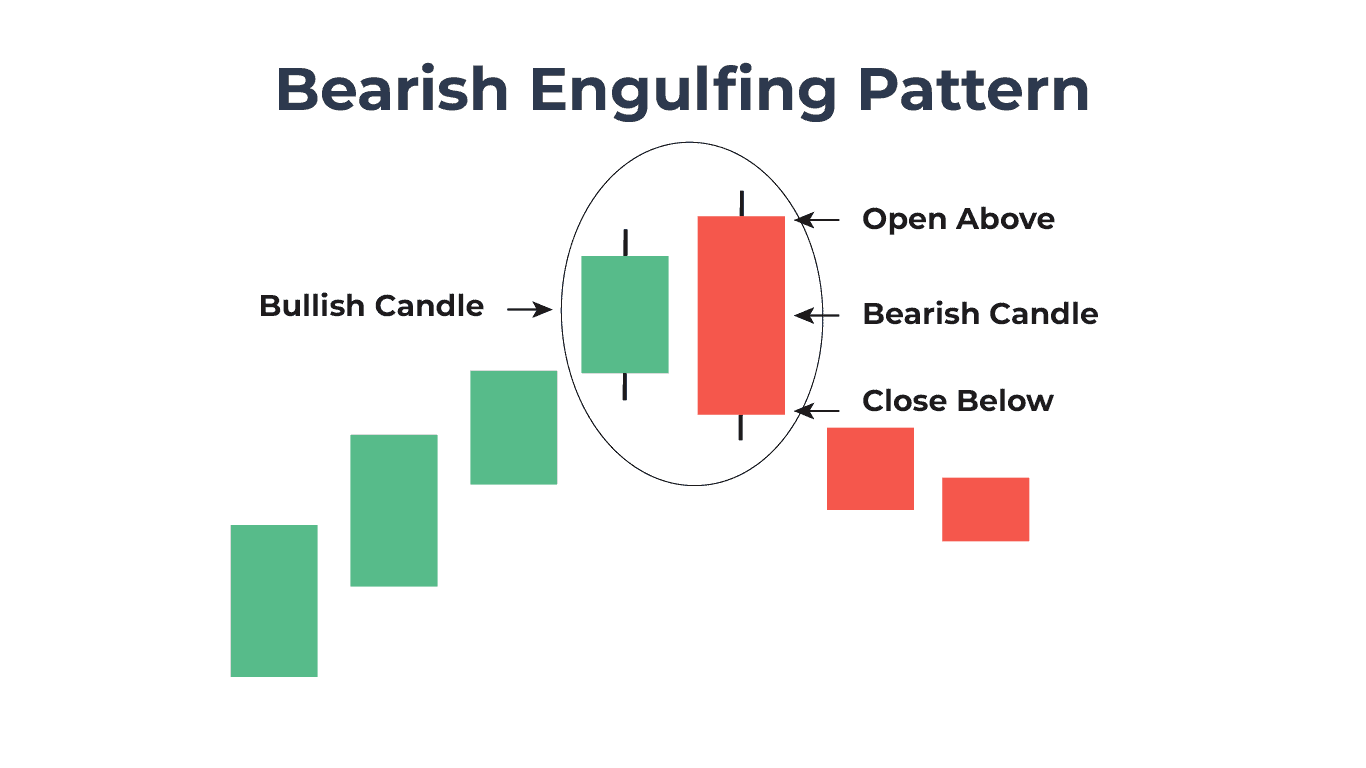
1. Bearish Engulfing Pattern
The bearish engulfing pattern is my #1 signal for catching trend reversals at the top of an uptrend. Here’s why it’s so potent:
Structure:
- First Candle: A bullish candle (normal or large).
- Second Candle: A larger bearish candle that completely engulfs the prior candle’s body.
Psychology: Bulls lose control as sellers overwhelm buyers, triggering a shift in market sentiment.
Trade Entries: On any bearish pattern that you choose, look for an engulfing candle as further confirmation and short on a close below the candle’s low.
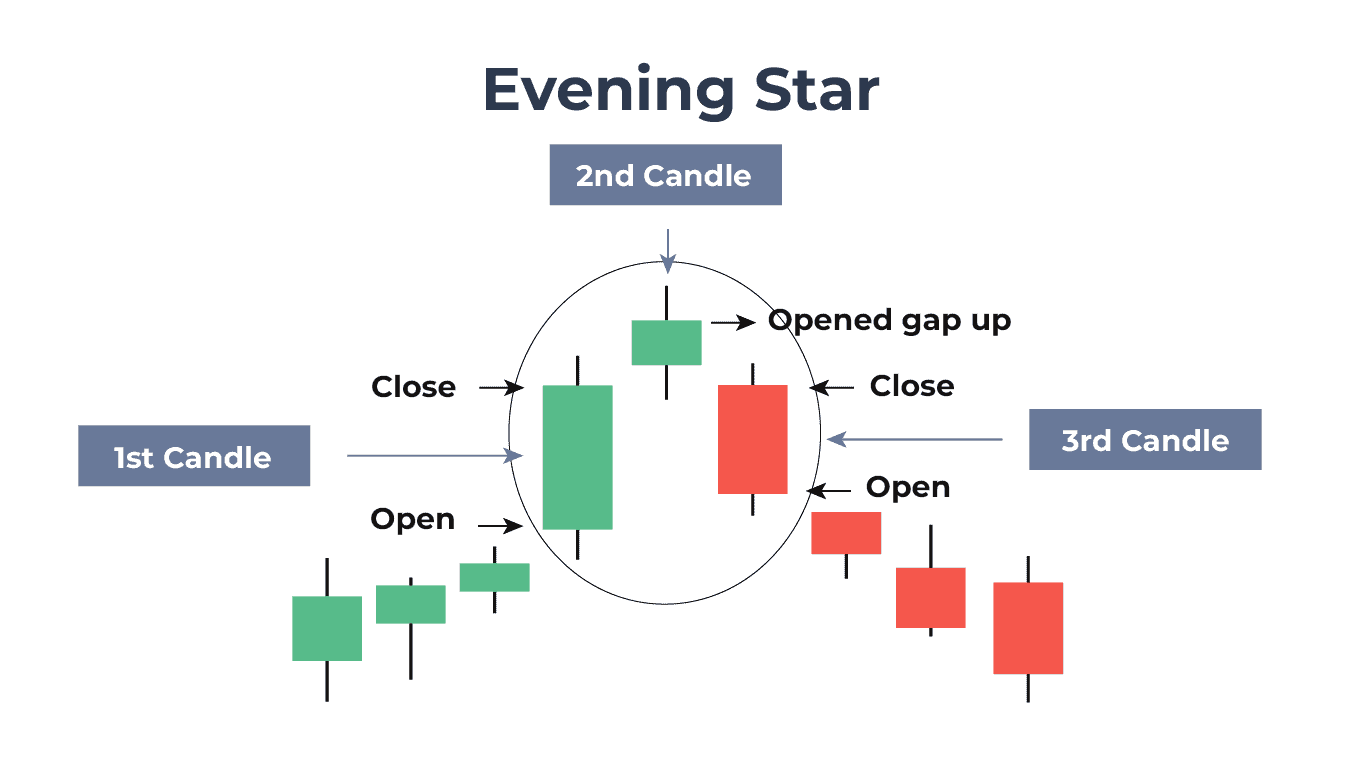
2. Evening Star
The evening star candlestick pattern is a slow-burn reversal setup I use for swing trades. It’s a three-part story of hope, doubt, and collapse. You might get further confirmation if you see a double top of the first candle and the second candle’s wicks:
Structure:
- First Candle: A strong bullish candle.
- Second Candle: A small bullish candle or doji (indicating indecision).
- Third Candle: A bearish candle closing below the midpoint of the first candle.
My Trading Plan:
- Entry: Short on a close below the third candle’s low.
Remember that the evening star mirrors the transition from greed to fear. The small bullish candle (star) lures complacent bulls before the bearish reversal crushes them.
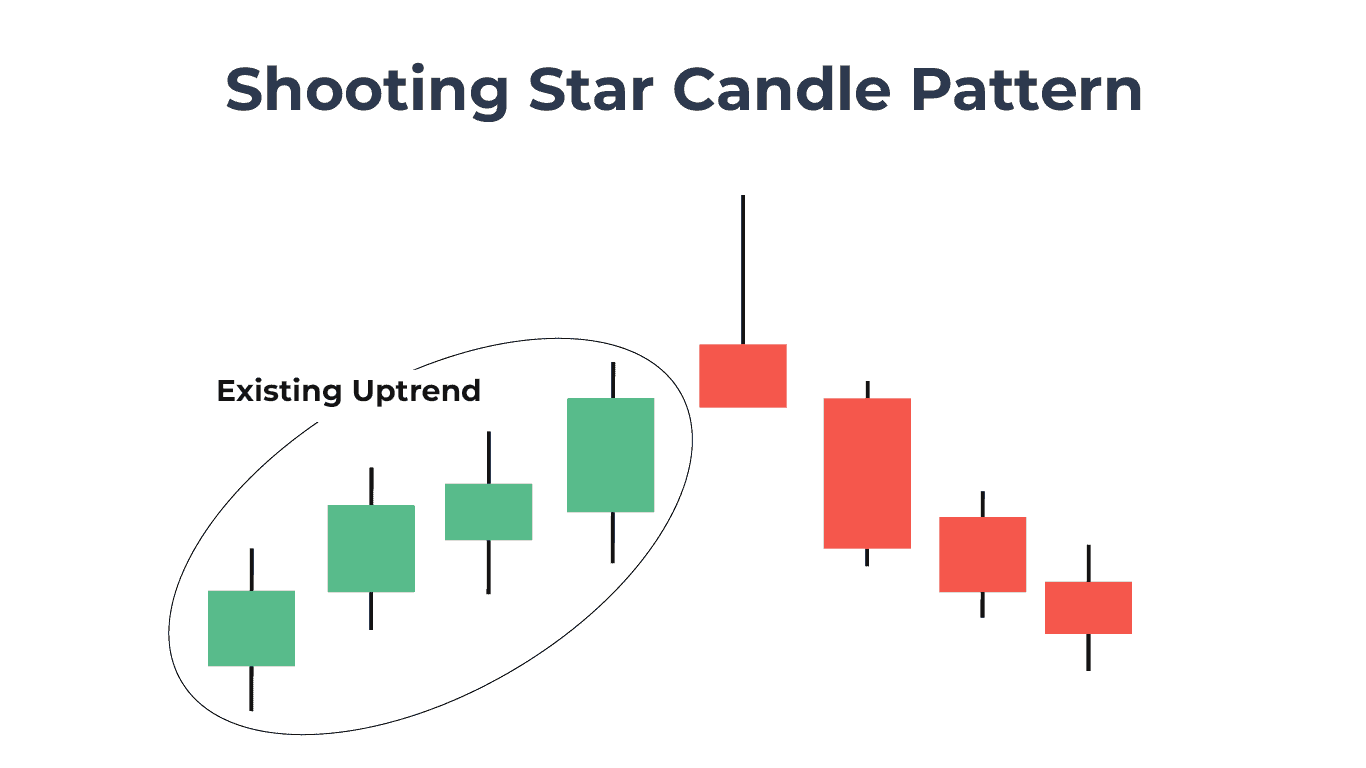
3. Shooting Star
The shooting star candlestick pattern is my go-to for spotting exhaustion after a rally. Don’t ignore this small candle—it’s a great bearish indicator.
Structure:
- A bullish candle with a tiny body and a long upper wick (at least 2x the body).
- Forms after a strong upward trend.
My Trading Plan:
- Entry: Short on a bearish candle closing below the shooting star’s low.
- Stop-Loss: Above the shooting star’s wick.
- Target: Nearest swing low or 1:2 risk-reward.
Key Tips:
- The longer the wick, the stronger the signal.
- Validate with declining volume during the upward trend (divergence).
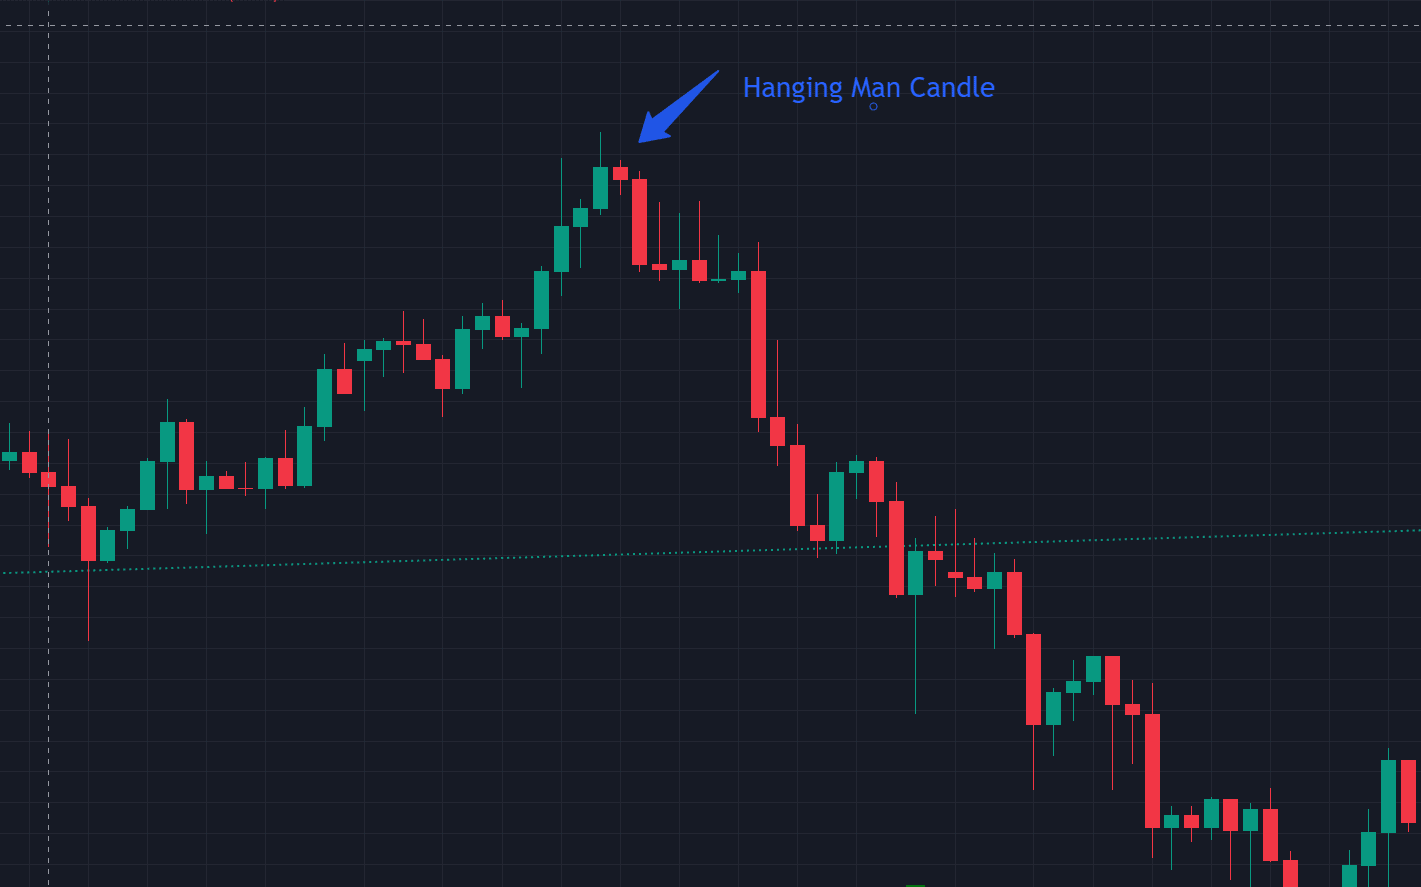
4. Hanging Man
The hanging man is often confused as regular bullish momentum, and is perhaps where most longs get trapped in the history of trading. The key is spotting where in a chart and how it forms.
Structure:
- A small body with a long lower wick (2-3x the body).
- Little to no upper wick.
My Trading Plan:
- Entry: Short on a bearish candle closing below the hanging man’s low.
- Stop-Loss: Above the hanging man’s high.
- Target: Previous support level or trendline.
If you are a beginner trader, I suggest skipping this one as it’s easy to confuse it for a buy setup.
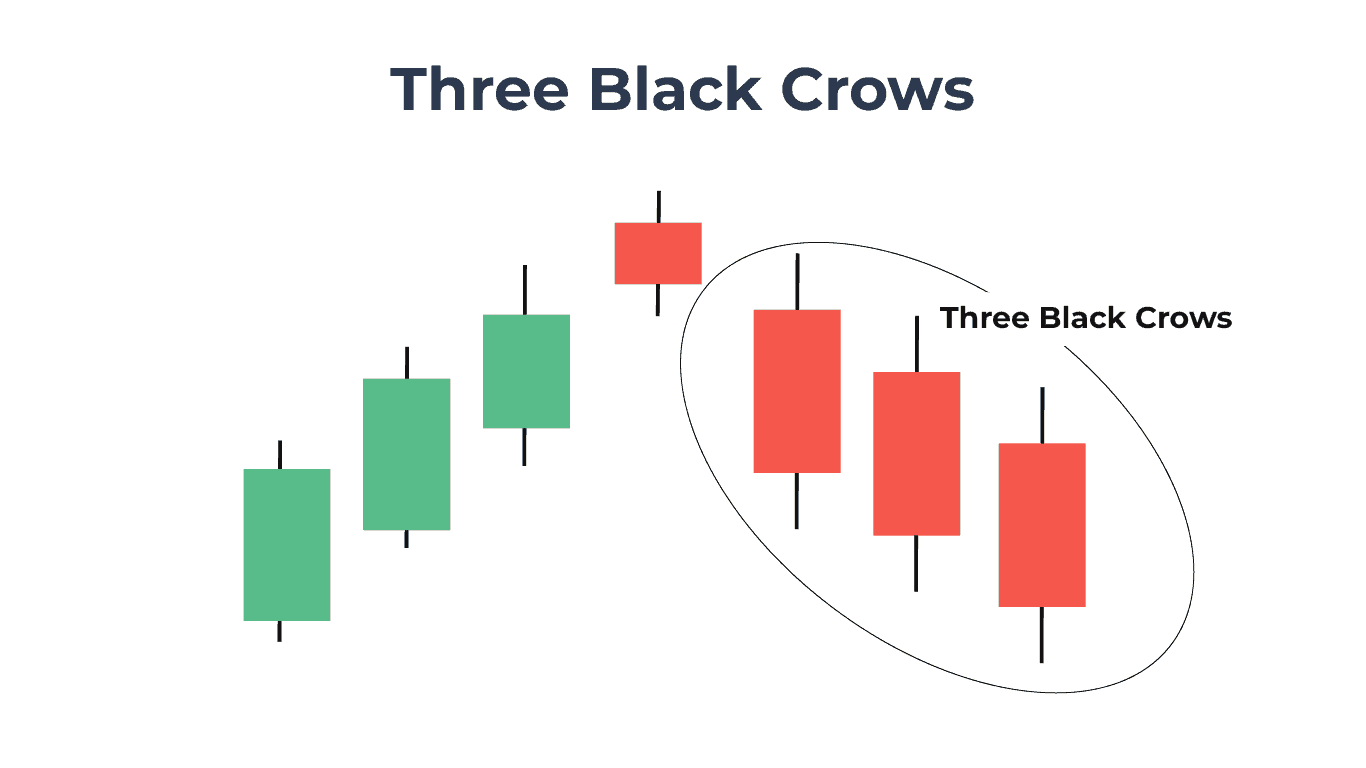
5. Three Black Crows
When I see three consecutive long bearish candles with lower closes—the three black crows pattern—I know bears are starting to set in.
Structure:
- First Candle: A bearish candle closing near its low.
- Second/Third Candles: Similar bearish candles with no significant wicks.
My Trading Plan:
- Entry: Short at the close of the third candle.
- Stop-Loss: Above the first candle’s high.
- Target: Height of the three-candle formation is projected downward.
Key Tips:
- Works best after parabolic rallies (classic “blow-off top” scenarios).
- Confirm with a bearish MACD crossover or volume spike.
My Thoughts on Trading Single Candles:
Always remember that while bearish candlestick patterns are powerful, they are not infallible. A long upper shadow on a shooting star or a small bullish candle in a bearish harami could merely indicate temporary profit-taking rather than a full reversal.
This is why traders often wait for confirmation—such as a final strong bearish candle closing below a key support level—before acting. Pairing these Forex patterns with tools like moving averages or volume analysis strengthens their predictive power.
What is Bearish Trading?
Forex markets move especially quickly during negative geopolitical news, bad earning announcements and bearish monetary policy. Sometimes markets also price in what is expected – such as news of no rate cuts or high unemployment rates.
Many times, markets can also go down even without any bearish news, simply due to an overbought currency. Being a bearish trader is all about staying on top and using past price action to predict future price movement.
While there is no end to greed during price action to the upside, especially after breaking past resistance, timing bearish reversal is much easier than calling the top:
- Patterns like the evening star candlestick pattern or dark cloud cover excel at marking the end of an uptrend.
- Confirmation tools: A bearish reversal signal (e.g., three consecutive bearish candles) paired with a divergence on the RSI? That’s high-probability ammunition.
- Risk management: A long bearish candle breaking support gives you an easy to set stop-loss level.
Even if you don’t trade massive market crashes every day, the same patterns and fractals apply on smaller timeframes, meaning you can effectively short as a scalper as well.
Psychology Behind Bearish Trends
Bearish trends thrive on fear. When a currency pair starts slipping, panic sets in. Retail traders cling to losing positions, hoping for a reversal, while institutional players pile into shorts, amplifying the drop. But there’s a flip side: greed.
The moment traders smell blood, they’ll chase the move, shorting aggressively without confirmation. I’ve seen countless traders blow accounts because they mistook a temporary dip for a full-blown crash. The key? Wait for the market to prove the bearish bias and know what these small clues look like.
Understanding Market Context
Don’t open your short after the price has already been in a downtrend for multiple candles on your timeframe! If a stock has gone from $20 to $10 throughout four red weeks, don’t be the trader shorting it at $10 and getting liquidated after a bounce.
You as a trader want to short after a stock has been overextended with buyers – think of it this way: if you ran a marathon one half marathon and then miraculously ran one more without a break, what’s the likelihood you will run one more marathon?
It’s the same with trading – look for price action that has gone to the upside massively and is looking tired – e.g. shows a double top on volume or look for signs of weakness – break below support in a downtrend etc…
Always remember: where a pattern forms on the chart matters just as much as the actual pattern itself!
Over the years, I’ve learned that even the most textbook bearish engulfing pattern or three black crows can fail if the broader market context isn’t aligned. Here’s how I assess conditions before acting on any bearish reversal signal.
1. The Importance of Trend Analysis
Before hunting for bearish candlestick patterns, I always start with the trend. Why? Because bearish reversals have the highest success rate when they counter exhausted bullish momentum.
Here is my process summarised in brief:
- Higher Timeframes: Daily and weekly charts reveal the dominant trend. A bearish reversal pattern on a 4-hour chart means little if the monthly trend is still a bullish pattern.
- Moving Averages: I watch the 50- and 200-day EMAs. A “death cross” (50-day crossing below 200-day) often precedes sustained bearish sentiment.
- ADX Indicator: Readings above 25 signal a strong trend. Below 15? Choppy markets—avoid bearish reversal traps.
2. Key Market Conditions for Bearish Patterns
Not all markets are primed for bearish reversals. I wait for these conditions:
- Overbought Markets: An RSI above 70 or Stochastic Oscillator peaking near 80 suggests exhaustion—a fertile ground for bearish engulfing or dark cloud cover patterns.
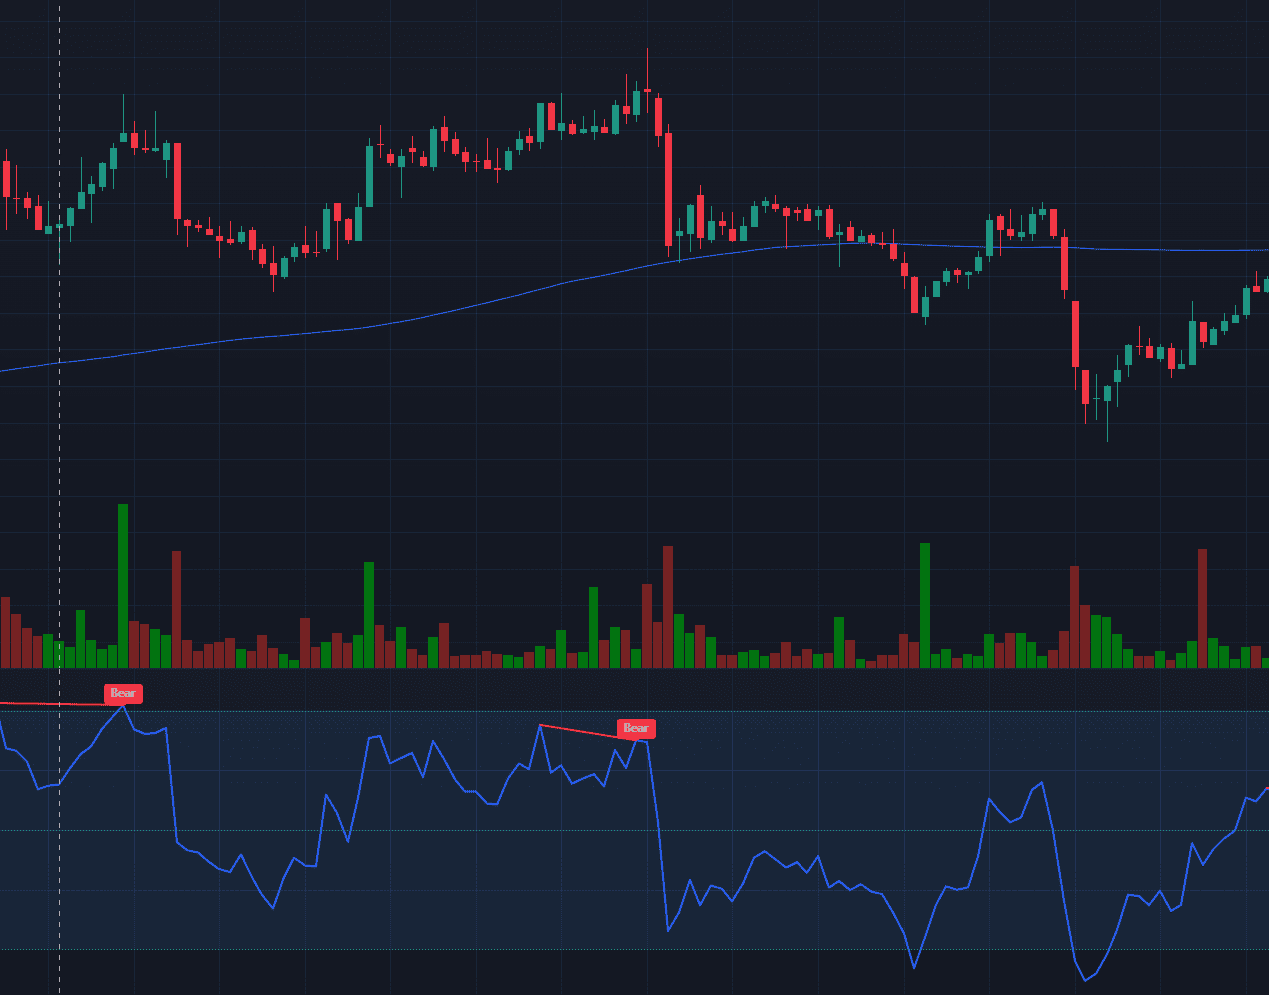
- Bearish Divergence: When price makes higher highs but momentum indicators (e.g., MACD) make lower highs. This occurrence often foreshadows a shift in market sentiment.
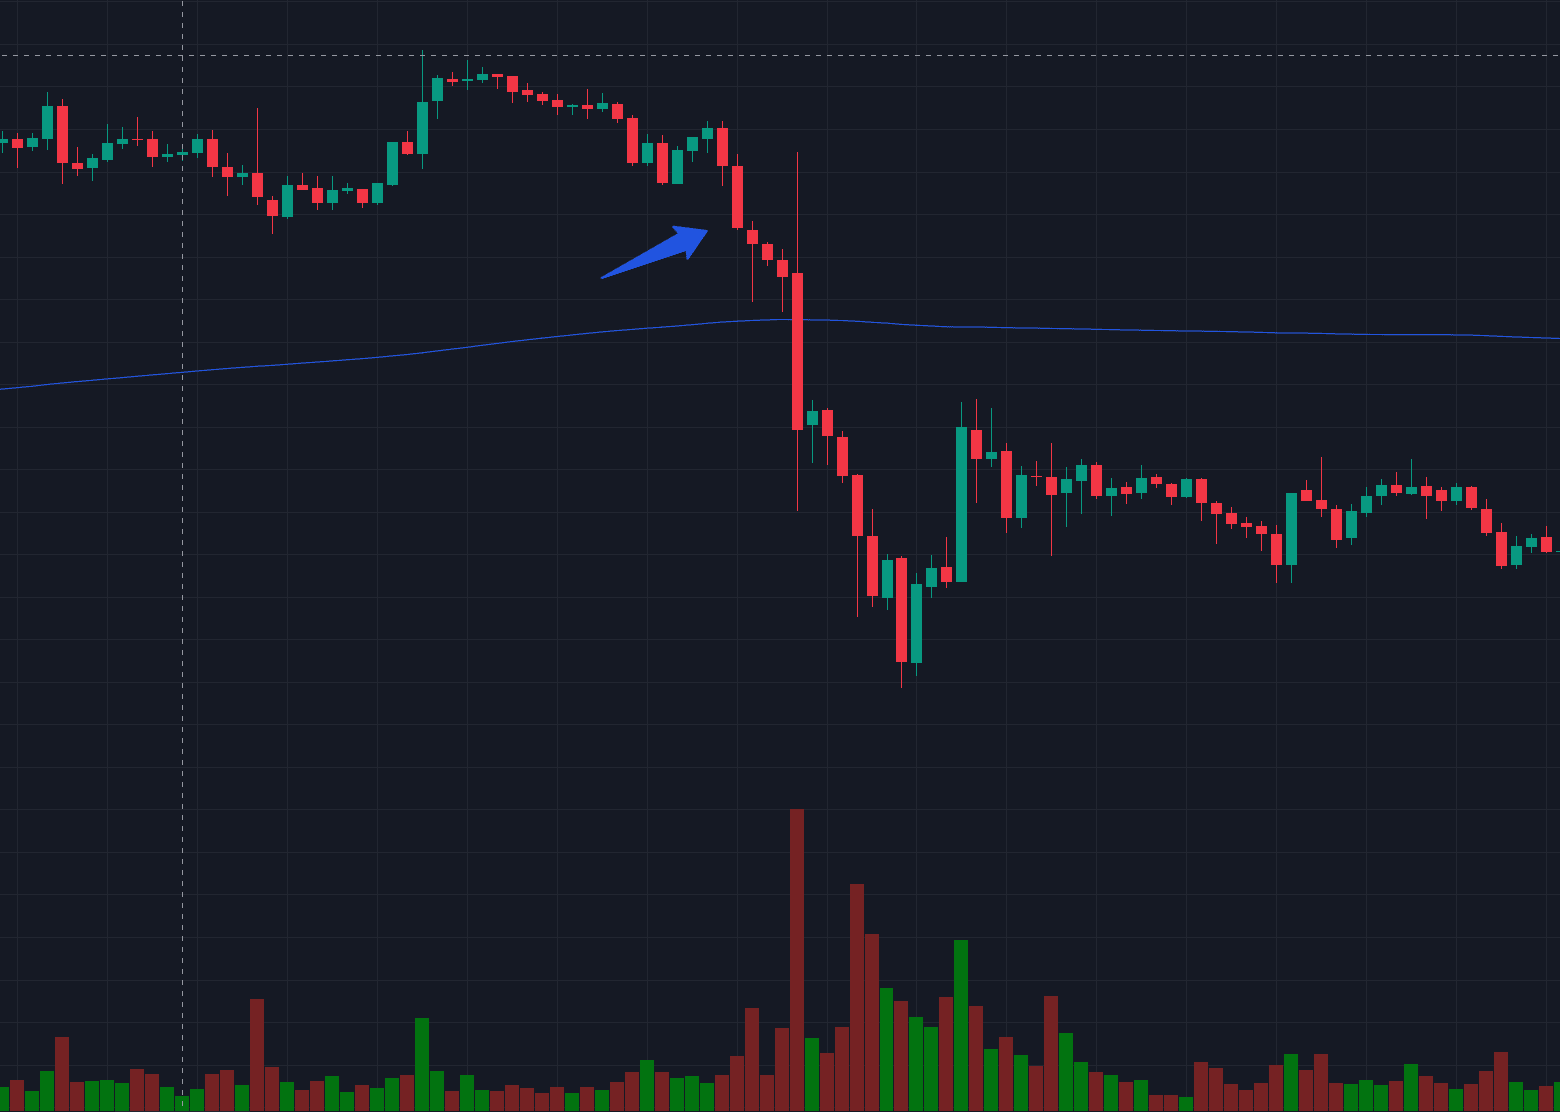
- Volume Spikes: A long bearish candle with surging volume adds credibility. It shows institutional selling, not just retail panic.
3. Sentiment Shifts and Fundamental Triggers
Candlestick patterns reflect psychology, but fundamentals fuel the fire. I prioritise:
- Risk Aversion: Safe-haven currency rallies (e.g., JPY, USD) often follow geopolitical crises or weak economic data. These environments magnify bearish reversal signals.
- Central Bank Policy: Hawkish statements (e.g., rate hikes) can abruptly reverse bullish momentum, turning bullish candles into bearish trend reversals. Avoid going short before SEC press conferences or other planned financial briefs.
- Price Action Clusters: A dark cloud cover pattern near a major resistance level? That’s a confluence. Pair it with bearish fundamentals, and the odds tilt in your favor.
I always have a small alert setup on my TradingView account to notify me of upcoming monetary press releases.
Most Reliable Bearish Chart Patterns
In my two decades trading forex, I’ve relied on a handful of bearish chart patterns that consistently signal shifts in market sentiment and trend reversals. These patterns aren’t just lines on a screen—they’re stories of greed turning to fear, and they’ve padded my account more times than I can count.
Below, I break down the six setups I trust most, how I trade them, and the traps to avoid.
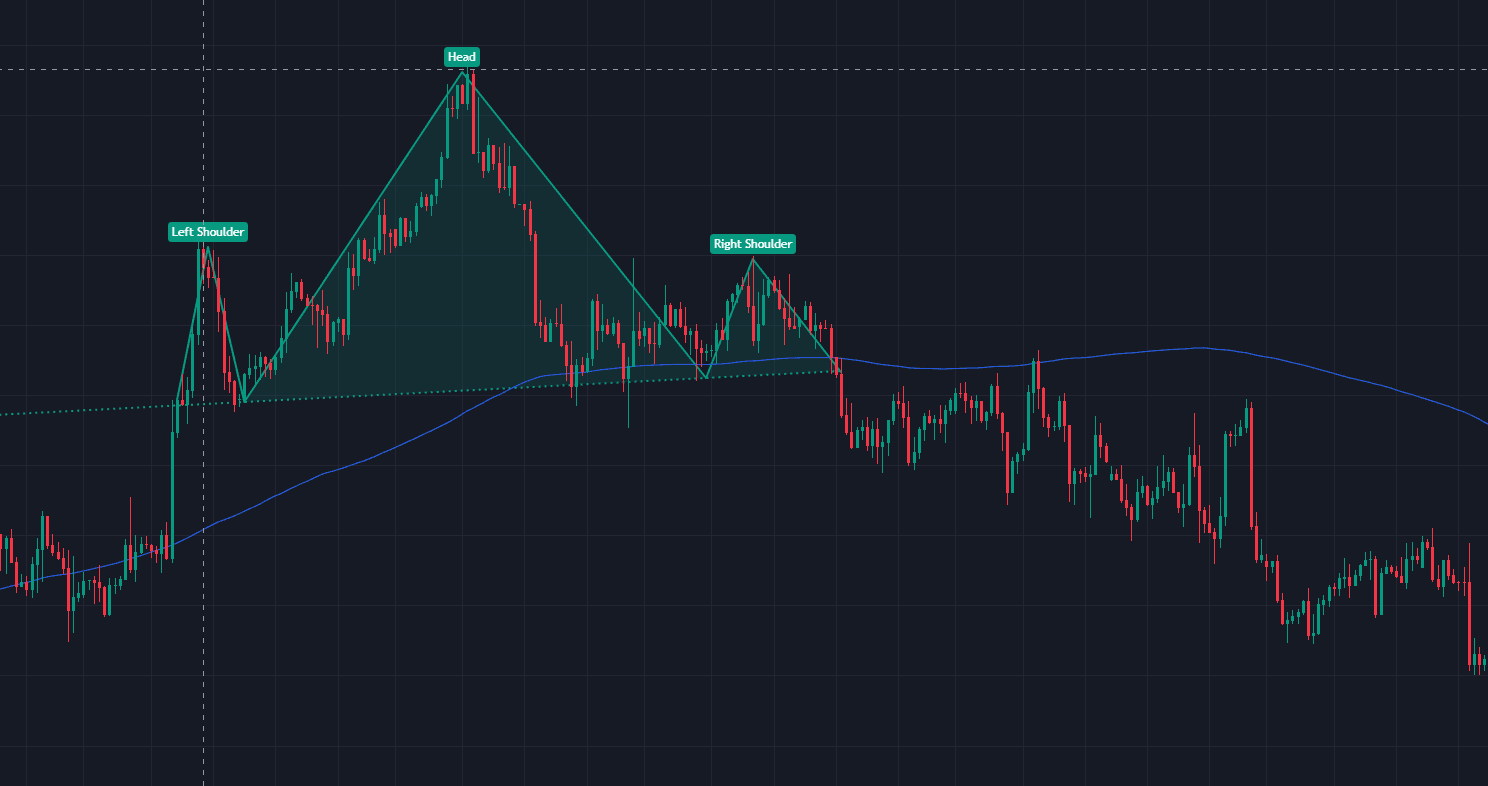
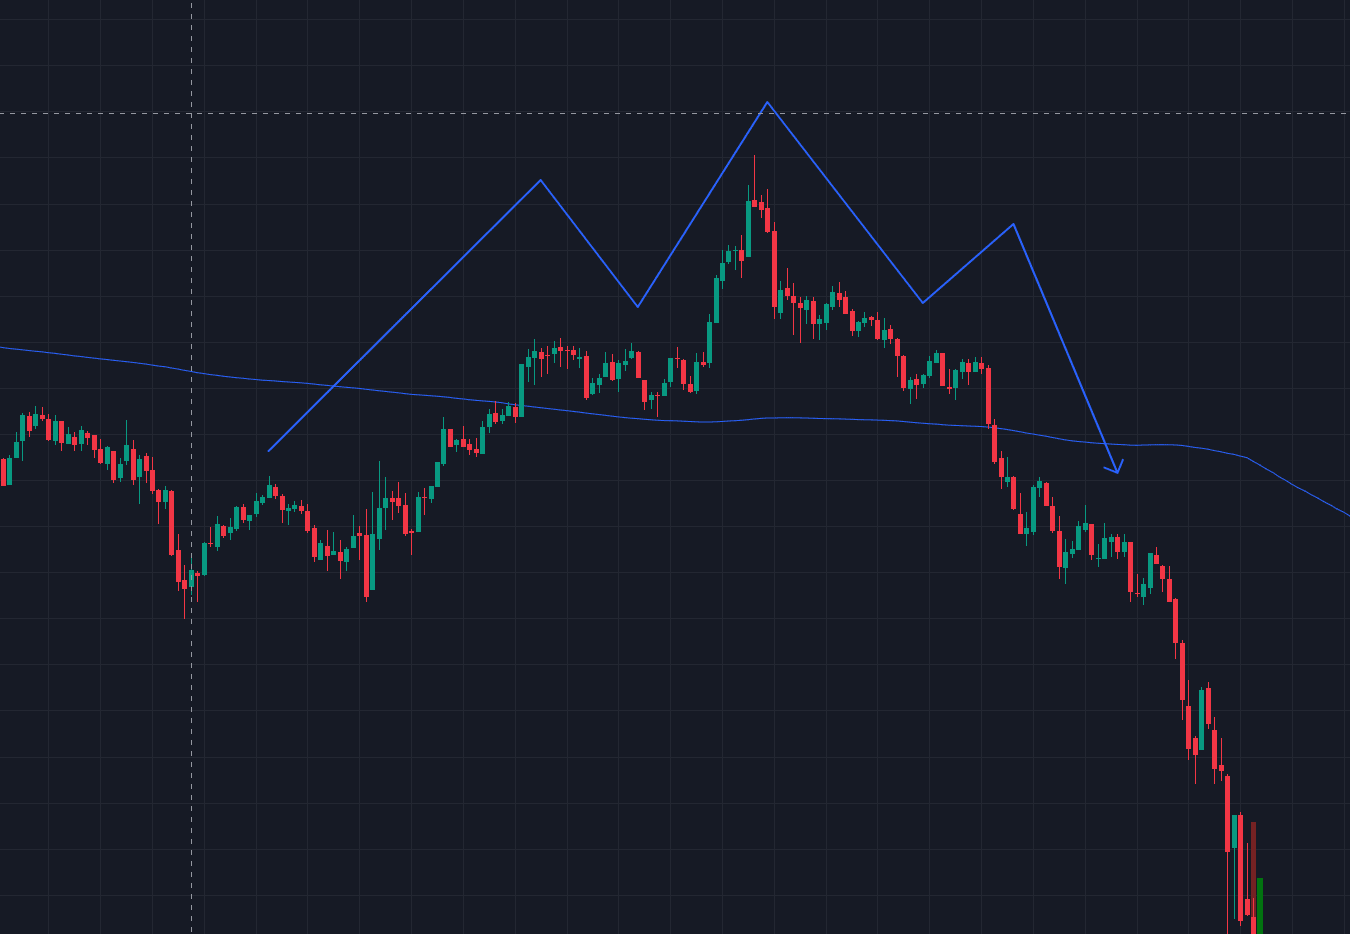
1. Head and Shoulders (H&S)
The Head and Shoulders is my go-to for spotting major bearish trend reversals at the top of an uptrend. Here’s how I dissect it:
Structure:
- Left Shoulder: A peak followed by a pullback (last gasp of bullish momentum).
- Head: A higher peak, then a deeper retracement.
- Right Shoulder: A lower peak failing to match the head, confirming weakening buyers.
- Neckline: The support line connecting pullback lows. A break here seals the bearish reversal.
My Strategy:
- Short on neckline breakdown, with a stop-loss above the right shoulder.
- Target: Measure the head’s height from the neckline and project downward.
What to Avoid: Wait for a close below the neckline. False breaks are common, especially in choppy markets.
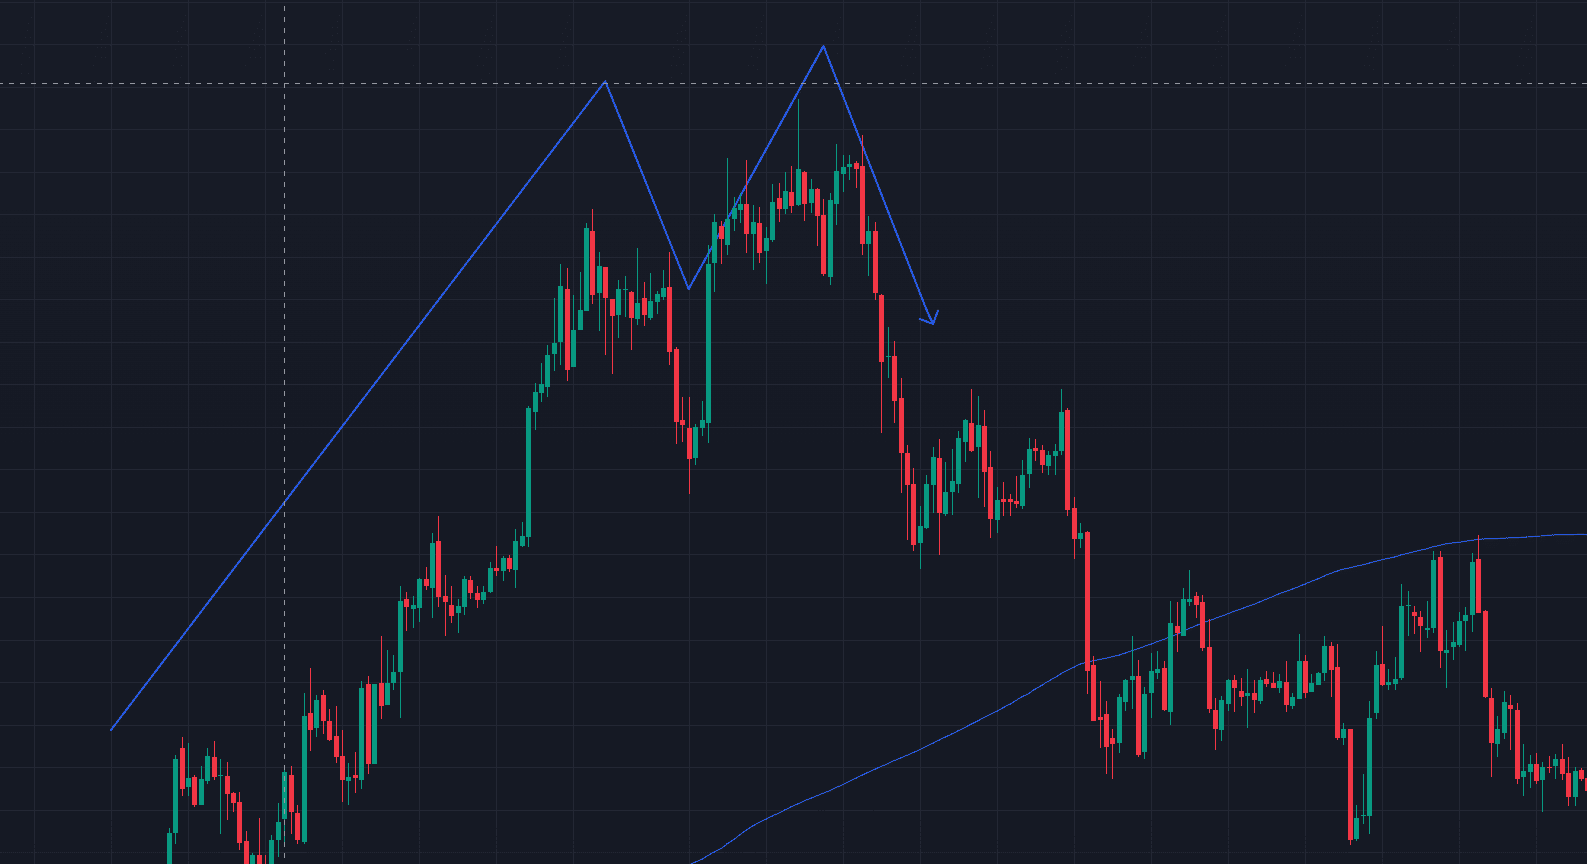
2. Double Top
The double-top pattern is my favourite bearish signal of all time. You can go back to charts from a hundred years ago, and a hundred years into the future, and you will always find it. The pattern appears after forming a second peak, which represents trapped bulls—those who bought the first top now rush to exit, fueling the drop.
When prices test a resistance or supply level twice and fails, this is a default confirmation of a potential downtrend.
Here’s my playbook on trading the double top:
Identification:
- Two distinct peaks near the same level.
- The trough between them (neckline) acts as support.
- Double tops usually form with large-bodied green candles, often with large topping tails.
Tips on Entering a Short:
- Enter short on a close below the neckline.
- Measure the pattern’s height and subtract it from the breakdown point for a target.
What to avoid: Be careful of shorting in an uptrend with consecutive higher highs, as sometimes the pullback is brief and the price goes on to trend higher. Look for blowoff top indicators, such as high depth of retracement, or nearing past resistance areas.
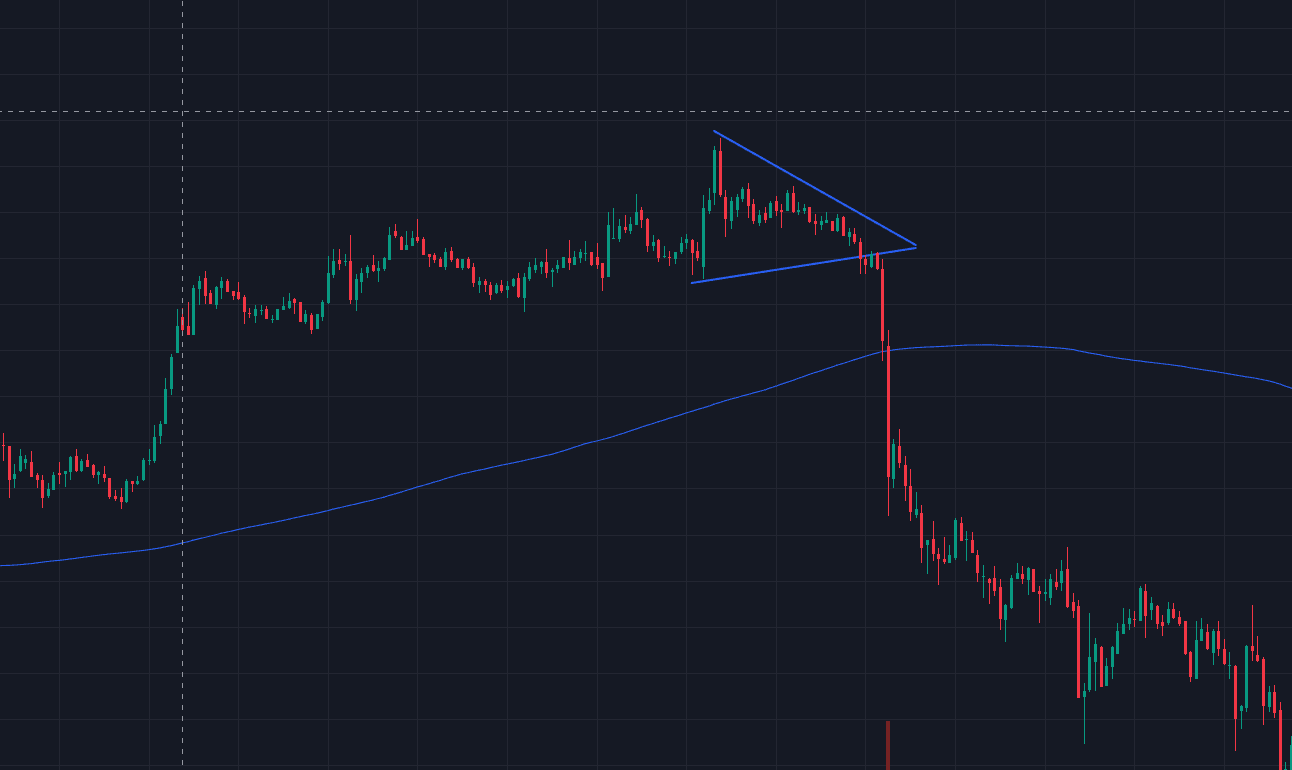
3. Descending Triangle
This continuation pattern thrives in downtrends but can also signal a bearish reversal. My rules:
Structure:
- Lower Highs: Sellers aggressively cap rallies.
- Horizontal Support: Buyers defend a price level until they’re overwhelmed.
Execution:
- Short on a breakdown below support, ideally with rising volume.
- Target: Height of the triangle’s widest section.
- Pair with RSI < 50 to confirm bearish bias.
Invalidation Insight: False breakouts happen if the triangle forms in a range-bound market. Check your 7 or 50 moving averages for further confirmation on scalp trades.
4. Bearish Flag/Pennant
The bearish flag and pennant are my bread-and-butter continuation patterns for riding aggressive downtrends. These setups thrive on panic—they’re the calm before the storm, where weak hands catch their breath before the next leg down. Let me walk you through how I trade them.
Structure & Identification of a Bearish Flag:
- Flagpole: A sharp, near-vertical decline (driven by panic selling or bad news).
- Flag: A slight upward or sideways price movement in a narrow channel, reflecting temporary consolidation.
Bearish Pennant:
- Flagpole: Same steep initial drop.
- Pennant: A small symmetrical triangle with converging trendlines, indicating indecision before the next move.
Trading Execution:
- Entry Trigger: Short on a close below the flag/pennant’s lower boundary.
- Stop-Loss Placement: Above the pattern’s highest swing. For pennants, this is often the apex of the triangle.
- Profit Target: Measure the flagpole’s height (from start to base) and project it downward from the breakdown point.
Only trade these in established downtrends. A pennant in an uptrend is a bull trap, not a bearish continuation pattern.
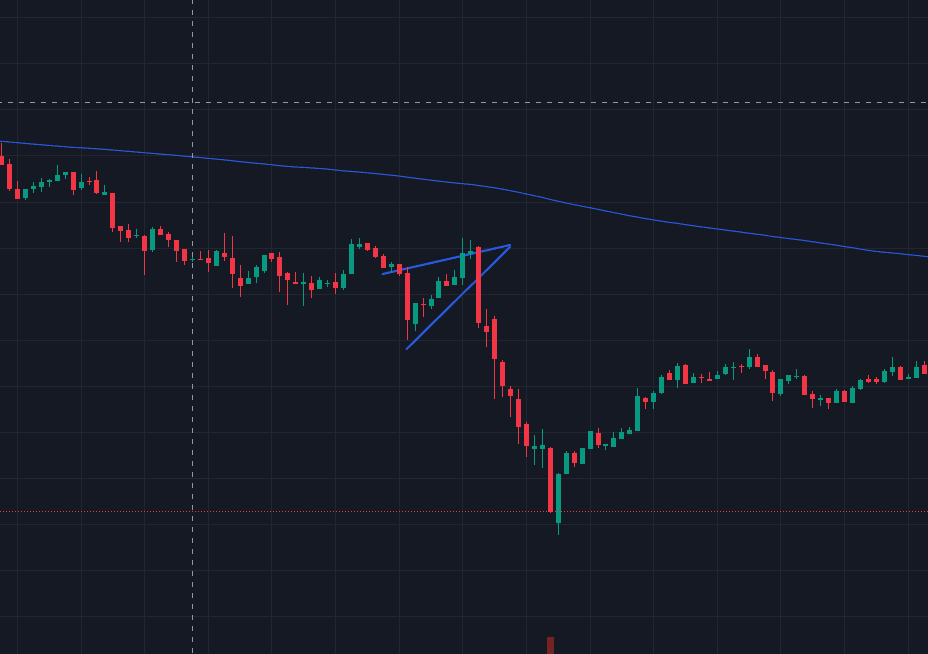
5. Rising Wedge (Bearish Reversal)
The rising wedge is one of my favorite stealth setups—it masquerades as an uptrend but often ends in a brutal bearish reversal. I’ve seen countless traders fall for its illusion of strength, only to get caught in the collapse.
This pattern occurs when buyers push price upward with diminishing conviction, while sellers lurk beneath. The narrowing range indicates indecision before a breakdown.
Structure & Identification:
- Higher Highs and Higher Lows: Price appears to trend upward, but the range between peaks and troughs narrows.
Converging Trendlines: Connect the highs (resistance) and lows (support) to form a wedge.
My Trading Strategy
- Entry Trigger: Short on a decisive close below the wedge’s lower trendline. This confirms the shift in market sentiment from hope to fear.
- Stop-Loss Placement: Above the most recent high within the wedge.
- Profit Target: Measure the wedge’s height at its widest point and project it downward from the breakdown.
The pattern thrives in overextended markets where bullish momentum is fading. Retail traders pile into “dips,” unaware of the impending reversal. As already mentioned, forex lacks volume, so I watch for declining tick activity as the wedge forms—a sign of waning buying pressure.
Harmonic patterns (e.g., Bearish Bat or Crab) can also be used to align with bearish reversals, making this a natural fit if you are a traders seeking geometric technical analysis
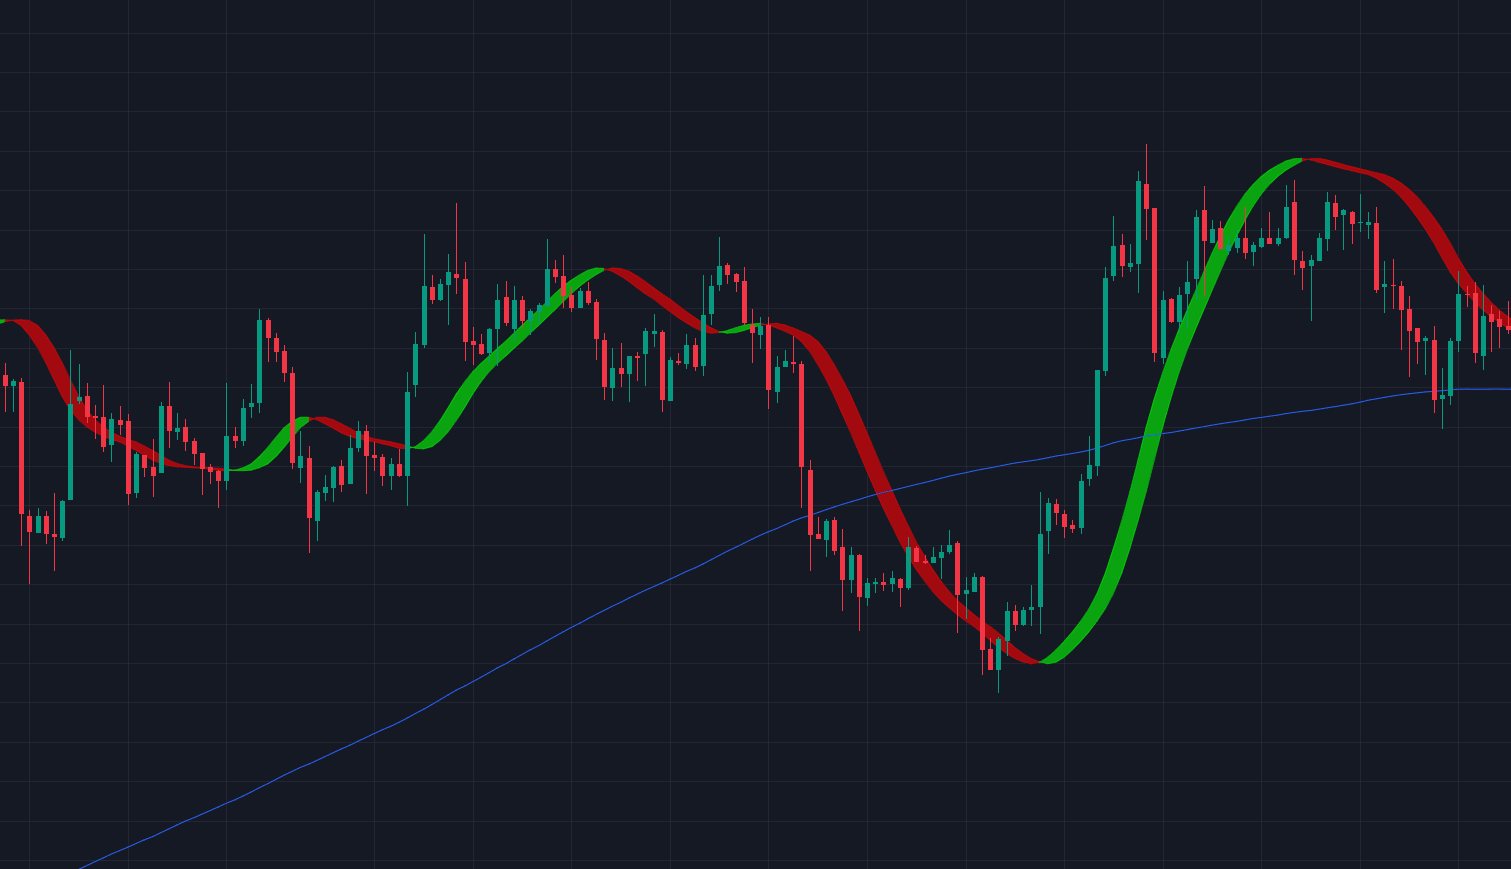
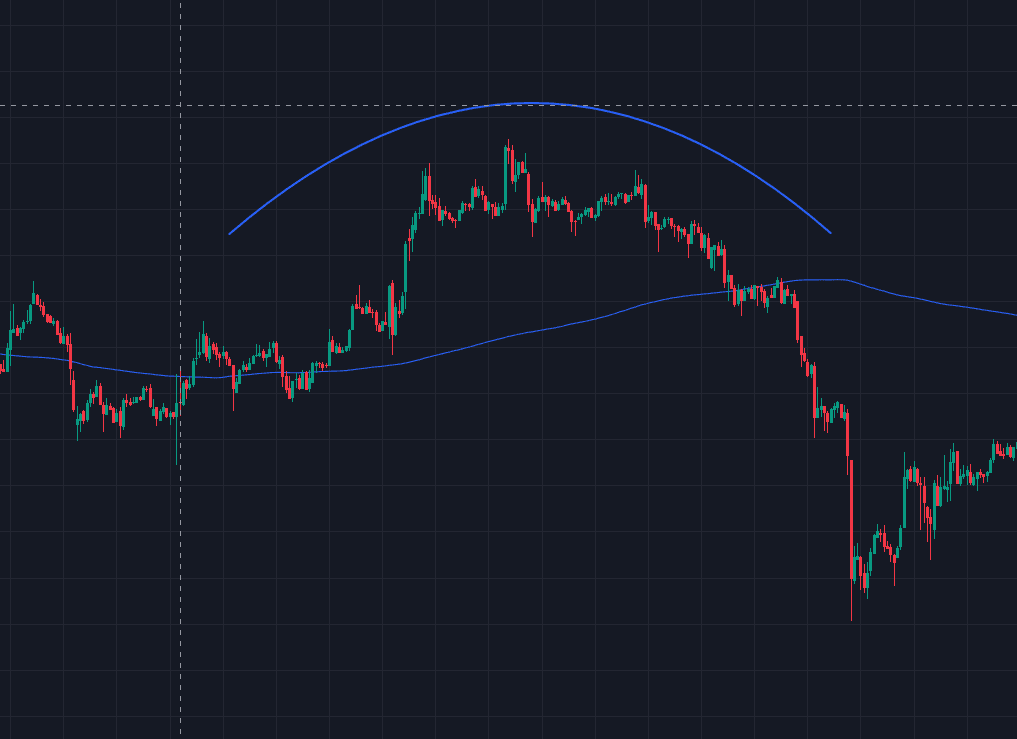
6. Rounding Top
The rounding top is a patient trader’s goldmine. It occurs when buyers lose steam incrementally. The lack of sharp sell-offs lulls bulls into complacency.
Unlike volatile patterns, it unfolds gradually, reflecting a slow but decisive shift in market sentiment. Here’s my approach to capitalising on this stealthy setup.
Structure & Identification
- Dome-Shaped Peak: Price arcs upward, then plateaus and curves downward, resembling an upside-down “U.”
- Declining Volume: Activity dwindles as the pattern forms (use tick volume or volatility indicators as proxies).
My Trading Strategy
- Entry Trigger: Short on a close below the “neckline”—the support level at the base of the rounding top.
- Stop-Loss Placement: Above the pattern’s highest point.
- Profit Target: Measure the vertical distance from the peak to the neckline and project it downward.
7. Break Below Support With Nothing to The Left
This isn’t a classic pattern but is one of my more reliable bearish reversal signals. When price slices through a support level with nothing to the left—no prior price history—it’s often a one-way ticket south.
Formation:
- Clean Breakdown: Price breaches a horizontal or diagonal support level where the chart shows empty space (no historical price action) to the left.
- Volume Spike: A surge in selling pressure (use order flow tools or volatility indicators).
Psychology: Traders panic as “unknown” territory triggers stop-loss cascades and margin calls.
My Trading Strategy
- Entry Trigger: Short on a retest of the broken support-turned-resistance, or immediately after a strong close below the level.
- Stop-Loss Placement: Just above the breached support.
Technical Indicators to Confirm Bearish Signals
Even the most pristine bearish reversal patterns can fail without confirmation. I’ve learned to treat technical indicators like lie detectors—they separate high-probability setups from traps.
Here’s how I use moving averages, RSI divergence, and MACD histograms to validate bearish signals and sharpen my edge.
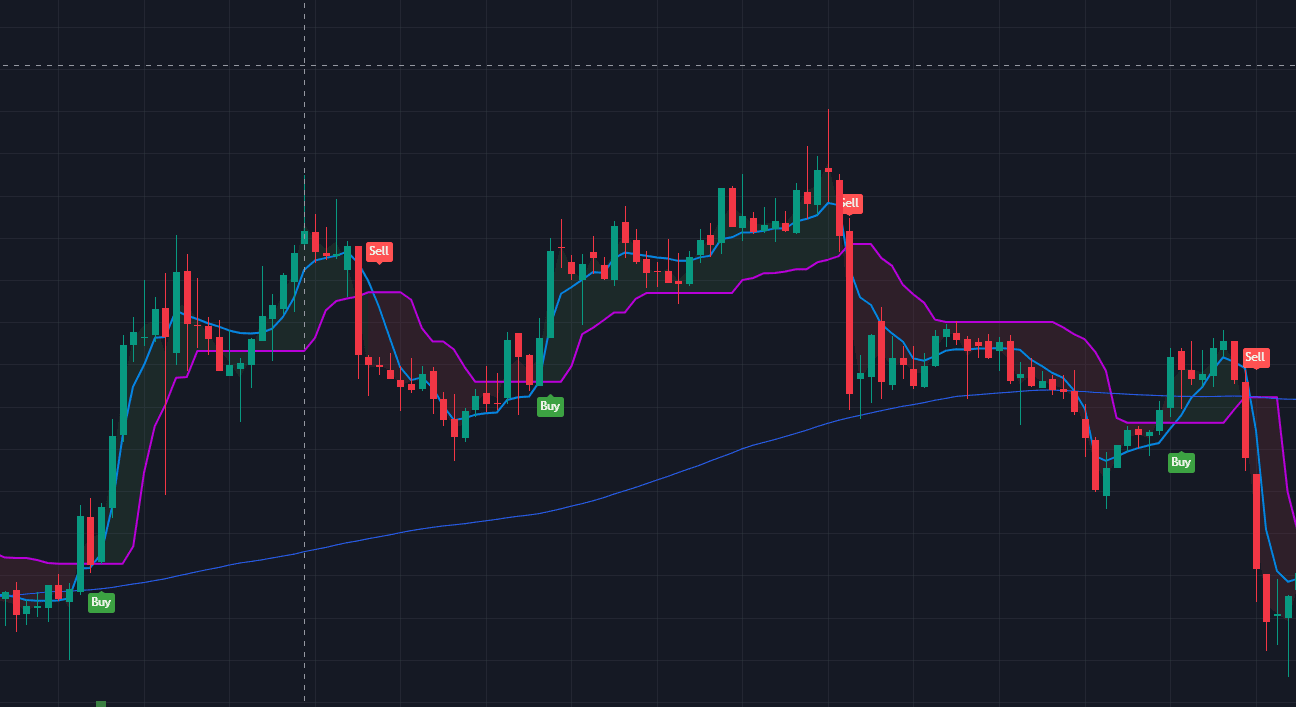
1. Moving Averages
Moving averages (MAs) are my first checkpoint. They cut through noise and reveal whether a bearish reversal aligns with the broader trend. My rules:
Death Cross (50-day vs. 200-day MA):
- When the 50-day MA crosses below the 200-day MA, it signals a long-term shift in market sentiment.
- I use this to filter trades: Only short bearish engulfing patterns or three black crows if the death cross is active or forming.
Dynamic Resistance:
- In downtrends, I watch for price rejecting key MAs (e.g., 20-day or 50-day). A shooting star or bearish harami at these levels? High-odds short.
Try to combine MAs with candlestick patterns. For example, a bearish engulfing pattern at the 200-day MA in a death cross environment is golden.
2. RSI Divergence
The Relative Strength Index (RSI) is my go-to for sniff out fading momentum. Here’s my playbook:
Bearish Divergence:
- Price makes a higher high, but RSI makes a lower high.
- This often precedes bearish reversals, especially after consecutive bullish candles.
Overbought Conditions:
- RSI above 70 + a bearish reversal candlestick pattern (e.g., evening star) = Short with confidence.
My Strategy:
- Wait for divergence to align with a bearish candle closing below a trendline or support.
- Avoid acting on divergence alone—it’s a warning, not a signal.
3. MACD Histogram: Tracking Momentum Shifts
The MACD histogram is my momentum magnifying glass. It shows whether bearish sentiment is accelerating or stalling:
Bearish Crossunder:
- When the MACD line (12-day EMA – 26-day EMA) crosses below the signal line (9-day EMA of MACD).
- I use this to confirm breakdowns from patterns like descending triangles or rounding tops.
Histogram Slope:
- Negative bars increasing in height? Bearish momentum is building.
- Negative bars decreasing? Shorts might be losing steam.
Key Tip:
- A trifecta is a bearish engulfing pattern with a MACD crossunder and rising negative histogram. I’ll size up my position here.
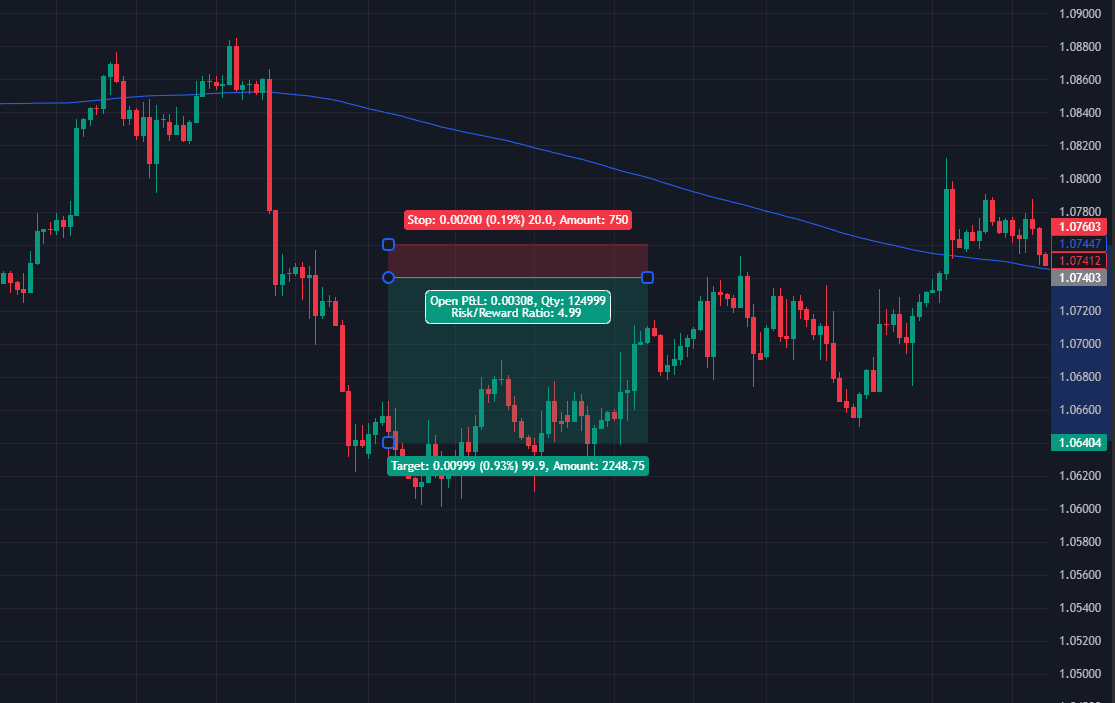
Risk Management in Bearish Trading
Position Sizing
I never risk more than 1-2% of my account on a single trade—no exceptions. Position sizing isn’t about greed; it’s about longevity. Here’s my formula:
- Calculate Risk Per Trade: 1% of capital ÷ (Entry price – Stop-loss price) = Position size.
- Adjust for Volatility: Wider stops? Smaller position. Tight stops? Size up cautiously.
Stop-Loss Strategies
Stops are NOT optional—they’re your lifeline. Here are some guidelines:
- Technical Anchors: Place stops above pattern highs (e.g., H&S right shoulder) or key MAs (200-day).
- Avoid Arbitrary Levels: Never base stops on round numbers or “gut feel.”
- Trailing Stops: Lock in profits as price falls (e.g., 50% retracement of the last swing).
I advise avoiding trailing stops if you are a beginner forex trader. Furthermore, don’t risk more than a few percent of your total account size per trade when starting out, so you can stay afloat even in a streak of losses.
Profit Targets
Profit target shouldn’t be moved once set, as this can quickly reduce your bottom line. I set profit targets using:
- Measured Moves: Pattern height projected downward (e.g., double top).
- Support Levels: Previous swing lows or Fibonacci retracements.
- Partial Closes: Bank 50% at Target 1, let the rest ride with a trailing stop.
Risk-Reward Ratio
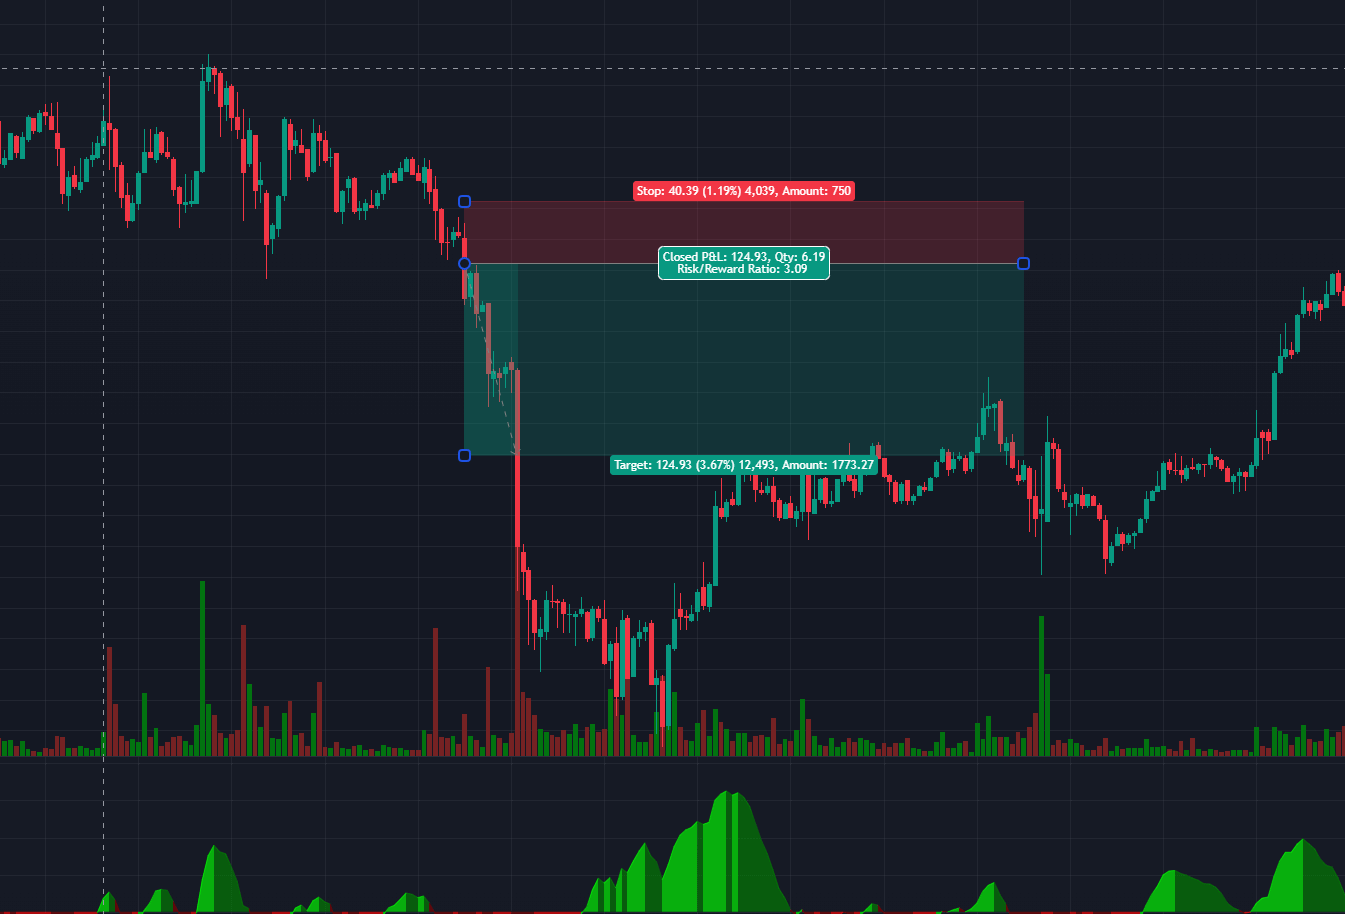
This depends on you as a trader. I personally go for 1:3, so my total success rate is below 50%, but I am still profitable. You must calculate your risk reward based on your profit targets. You can still be profitable as a 1:6 R trader the same as a 1:1 R trader.
Common Mistakes to Avoid Going Short
In a perfect vacuum it’s easy to avoid emotion swaying your judgement. That is why markets act irrationally, and you must be able to stay solvent so you don’t burn through your capital deposit. Here are some core principles I try to avoid in every trade:
1. Overlooking Confirmation
Jumping into a trade based solely on a bearish reversal pattern is like driving blindfolded. I’ve seen traders blow accounts ignoring technical indicators (RSI, MACD) or volume signals. To fix this, wait for a bearish candle to close below support or a moving average.
2. Ignoring Higher Timeframes
A bearish engulfing pattern on the 1-hour chart means nothing if the weekly trend is bullish. Always check daily/weekly charts. If they conflict, walk away.
3. Overtrading in Choppy Markets
Bearish patterns in sideways markets are traps. Chasing every signal burns capital. Use ADX (<25) or Bollinger Bands to spot ranges. Trade only clear trends.
4. Emotional Trading
Revenge-trading after a loss or doubling down on a failing position is detrimental. Set daily loss limits. Follow your plan—even when your gut screams otherwise.
Conclusion
Bearish trends test your emotional resilience. They’ll make you doubt your strategy, overthink your exits, and second-guess your analysis. But over time, you can learn to lean into the chaos. Trust your system, manage your risk (always!), and remember: the market doesn’t care about your biases, but will reward you greatly if you can read sentiment correctly and with realistic profit targets.
FAQs
1. Which bearish candlestick pattern is the most reliable?
The bearish engulfing pattern and three black crows are my top picks for reliability. The engulfing pattern’s clear power shift and the crows’ relentless selling pressure offer high-probability setups—if they align with:
- A confirmed shift in market sentiment (e.g., breaking below a trendline).
- Overbought RSI or bearish MACD divergence.
2. How do I avoid false bearish reversal signals?
Wait for confirmation: A bearish candle closing below support > a wick.
- Stack indicators: Pair patterns with technical indicators (e.g., 50-day MA rejection + RSI divergence).
- Check higher timeframes: A bearish engulfing pattern on the 4-hour chart is irrelevant if the weekly trend is bullish.
3. Can bearish patterns work in volatile markets?
Yes, but with caution. Volatility amplifies false breaks. My adjustments:
- Focus on continuation patterns like bearish flags/pennants (momentum-driven).
- Use tighter stops (1.5x ATR) and smaller position sizes.
Avoid single-candle patterns (e.g., shooting star) unless volatility declines (Bollinger Band squeeze).


Ask an Expert