Introduction to Harmonic Patterns
Harmonic patterns are geometric price formations on trading charts that utilize the application of Fibonacci ratios to disclose potential market points of reversal. Through decades of forex trading, I’ve come to the conclusion that these patterns are some of the most reliable tools for cutting through the noise of markets and finding high-probability trades.
Throughout this comprehensive guide, I’ll walk you through all you need to know regarding harmonic patterns—beginning with their basic structure and Fibonacci foundation all the way through to advanced trading strategies that can transform your forex trading strategy.
If you’re having trouble predicting trend reversals or want to add more precision to your technical analysis toolkit, studying patterns like the Gartley, Bat, and Crab can bring order and discipline that many traders lack.
What Are Harmonic Patterns?
Let’s start simple. Harmonic patterns are geometric shapes that repeat across multiple timeframes, signaling reversals at zones where Fibonacci retracements and extensions converge. I’ve traded everything from the bullish Gartley pattern in EUR/USD to the bearish Bat pattern in GBP/JPY, and they all share one rule: precision.
Here’s how it works:
- A pattern like the Gartley harmonic pattern forms after an initial price decline (the XA leg), followed by a retracement (AB leg) that respects the golden ratio (0.618).
- The CD leg then extends to a specific Fibonacci ratio (like 1.272 or 1.618), creating a pattern completion zone at Point D.
- When price hits that zone, I watch for price action clues—a pin bar, engulfing candle, or divergence—to confirm the reversal.
I’ve seen setups fail when traders ignore the underlying trend or force a Crab pattern where none exists. But when you nail the ratios and wait for the reversal zone to align with the overall trend, harmonic trading becomes a game of probabilities, not guesswork.
Why Use Harmonic Patterns in Forex?
Forex moves fast. One headline can trigger a 100-pip price swing in minutes. But here’s why I rely on harmonic trading:
Objectivity Over Hype
Unlike more open to interpretation candlestick patterns, harmonics demand strict rules. For a Bat harmonic pattern to be considered valid, the AB leg must retrace 0.382–0.50 of XA, and the CD leg needs a 1.618–2.618 extension of BC. No exceptions.
Risk-Reward Clarity
When I enter a long entry at a bullish fibonacci completion zone, my stop loss sits just below the swing low, and my profit target aligns with the next Fibonacci extension level. This discipline keeps my losses small and lets winners run.
Trend Synergy
A bearish harmonic pattern in a downtrend isn’t just a reversal—it’s a chance to ride the price decline after a pullback. Harmonic patterns work best when they echo the broader trend, not fight it.
Who Should Use Harmonic Patterns?
I’ll be blunt: harmonic trading isn’t for everyone. But if you’re the type of trader who:
- Thrives on structure (think AB=CD symmetry and Fibonacci sequence rules),
- Has the patience to wait for pattern recognition signals,
- And doesn’t panic when market noise creates false breaks,
Then harmonics will feel like finding a cheat code.
I’ve seen many traders who jumped in too early, mistaking a shallow retracement on a bullish pattern, only to get stopped out.
The key is to combine harmonics with Fibonacci tools and multiple timeframes. Since harmonic patterns work on any charts, including forex, I have learned to spot high-probability setups like the Butterfly pattern during London session opens or the Crab pattern ahead of Fed announcements.
The Foundations of Harmonic Trading
Let’s get one thing straight: harmonic trading isn’t magic. It’s a science built on three pillars—Fibonacci ratios, geometric precision, and an understanding of trader psychology.
Over the years, I’ve seen too many traders skip these foundations and jump straight into drawing bat patterns or crab patterns, only to blow accounts when their setups fail:
Fibonacci Ratios: The Backbone of Harmonic Trading
When I started trading, I thought Fibonacci numbers were just a math gimmick. Then I watched price reverse like clockwork at 0.618 retracements during the 2008 crisis. That’s when it clicked: markets breathe in Fibonacci ratios.
Here’s what you need to burn into your brain:
- The Golden Ratio (0.618): This is the superstar. In a bullish Gartley pattern, the AB leg typically retraces 61.8% of the XA leg. It’s the market’s “gravity zone” where buyers step in.
- 0.382 and 0.786: These act as secondary confirmation. A shallow 38.2% retracement often hints at a strong trend, while 78.6% is where reversals gain momentum (think bearish Bat pattern).
- Extensions (1.272, 1.618): These define profit targets. For example, in a crab pattern, the CD leg often stretches to 1.618x the BC leg—a high-reward zone where I book profits.
But here’s the kicker: harmonic patterns demand these ratios align perfectly. A Gartley harmonic pattern isn’t valid unless the AB=CD symmetry and retracement of XA hit those specific Fibonacci ratios. Miss one, and you’re gambling.
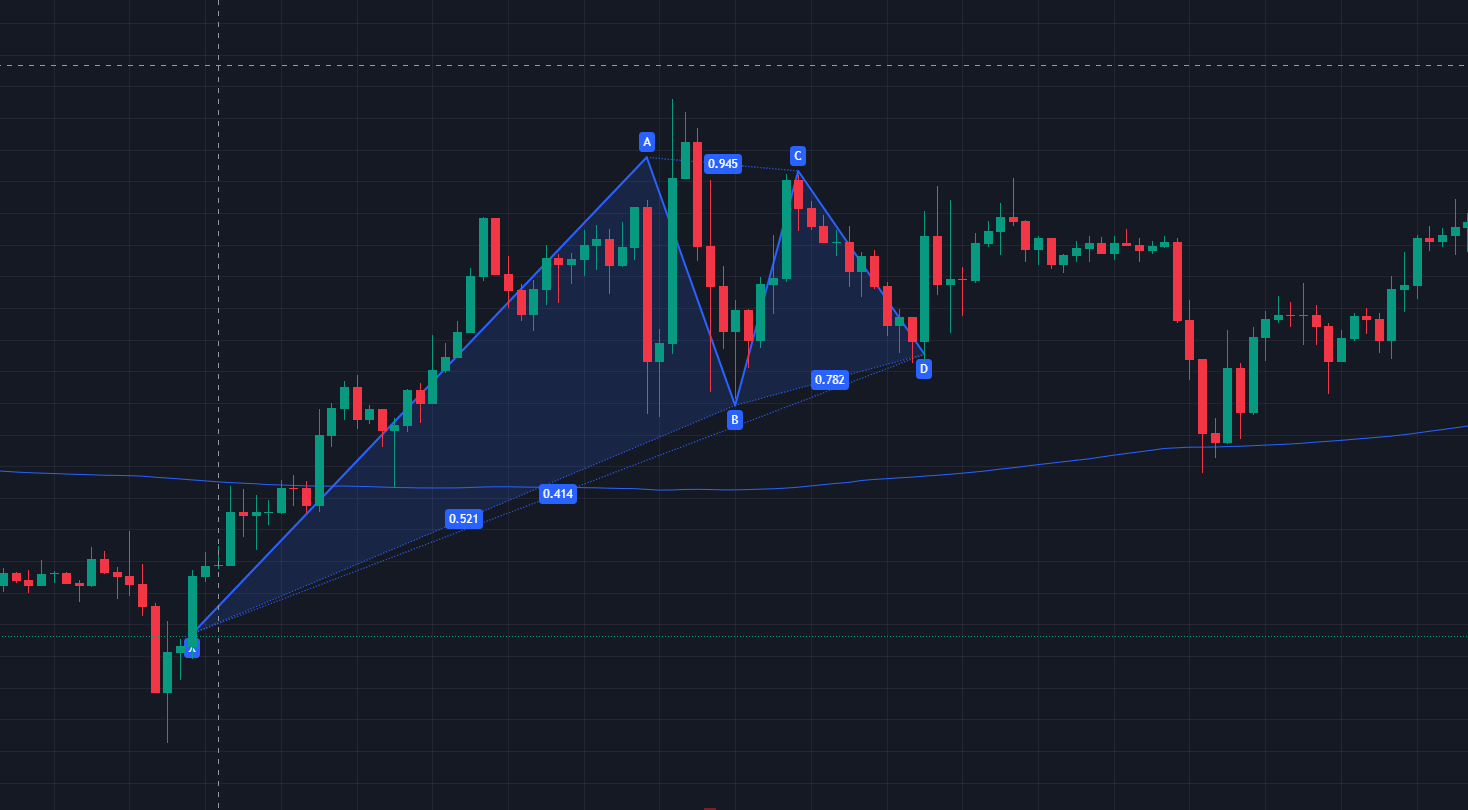
Structure of Harmonic Patterns: The XABCD Blueprint
Every harmonic pattern follows an XABCD structure. Let me decode this with a bullish Bat pattern I traded last month in EUR/USD:
- X to A (XA leg): The initial impulse wave. In my setup, EUR/USD rallied 200 pips (X to A).
- A to B (AB leg): A retracement of 38.2–50% of XA. Price pulled back 85 pips—a near-perfect 42.5% retracement.
- B to C (BC leg): A smaller counter-retracement (often 38.2–88.6% of AB). Here, it retested the 61.8% level.
- C to D (CD leg): The final leg, extending 1.618–2.618x BC. This leg hit 1.618 exactly, marking the pattern completion zone at Point D.
Why does this matter?
The CD line must align with the potential reversal zone (PRZ), where Fibonacci extensions and retracements overlap.
The AB=CD symmetry (equal time and price) adds confluence. If the legs don’t mirror, walk away.
I’ve learned to sketch these structures on a weekly chart first to spot the broader trend, then drill down to the 4-hour for entries.
Psychology Behind Harmonic Patterns
Markets are driven by fear and greed—and harmonic patterns exploit both. Let’s dissect a bearish Gartley pattern during a downtrend:
- Phase 1 (XA leg): Sellers dominate, creating a sharp price decline.
- Phase 2 (AB leg): Buyers jump in (“Bargain!”), retracing 61.8% of XA.
- Phase 3 (BC leg): Sellers reload shorts, testing the swing high near 78.6% of AB.
- Phase 4 (CD leg): The final flush. Weak longs capitulate as price hits the reversal zone, triggering a sell-off.
Here’s what most traders miss:
- The potential reversal zone isn’t just Fibonacci levels—it’s where stop losses cluster. Break that zone, and you get a fakeout.
- Price action (like a bearish engulfing candle at Point D) confirms the herd’s exhaustion.
Mastering harmonic trading starts with respecting the trifecta: Fibonacci ratios, structural rules, and crowd psychology. Skip one, and you’re just drawing squiggles.
But when you align them—like catching a bullish crab pattern at a swing low in an uptrend—you’ll see why this methodology is used by traders worldwide for over a decade.
Key Harmonic Patterns in Forex Trading
Harmonic patterns are the cornerstone of precision trading, offering structured frameworks to identify high-probability reversals.
These patterns emerge from the interplay of Fibonacci-driven trader psychology (profit-taking at key ratios), algorithmic order flow, and self-fulfilling market participation at historical reversal zones.
Below, we explore the six most impactful patterns for forex trading, detailing their geometries, Fibonacci ratios, and tactical applications.
1. The Gartley Pattern
This is a reversal pattern forming an XABCD structure, where precise Fibonacci ratios (e.g., 61.8% retracement of XA) align to signal exhaustion of the trend, reflecting market cycles of accumulation and distribution.
Structure: Bullish/Bearish XABCD formation.
Fibonacci Ratios:
- AB Leg: 61.8% retracement of XA.
- BC Leg: 38.2–88.6% retracement of AB.
- CD Leg: 127.2–161.8% extension of BC.
Trading Rules:
Bullish Gartley: Forms after a downtrend. The potential reversal zone (PRZ) at Point D aligns with the 78.6% retracement of XA and 127.2% extension of BC. Enter long on bullish price action (e.g., hammer candles).
Bearish Gartley: Emerges in uptrends. PRZ converges at the 78.6% retracement of XA and 127.2% BC extension. Short on bearish confirmation (e.g., shooting star).
2. The Bat Pattern
The bat pattern is a compact XABCD pattern with a deeper BC retracement (e.g., 161.8% extension), signaling reversals as price tests extreme Fibonacci levels, often driven by institutional order clusters.
Structure: Compact XABCD with tighter retracements.
Fibonacci Ratios:
- AB Leg: 38.2–50% retracement of XA.
- CD Leg: 161.8–261.8% extension of BC.
Trading Rules:
- Bullish Bat: PRZ at Point D combines 88.6% retracement of XA and 161.8% BC extension. Validate with trendline breaks.
- Bearish Bat: PRZ mirrors bullish rules in downtrends. Ideal for counter-trend corrections.
3. The Butterfly Pattern
Characterised by extended CD wings (161.8–224% BC extension), it forms when overextended price action reverses at Fibonacci confluences, reflecting panic-driven overreactions.
Structure: Extended wings with distinct PRZ.
Fibonacci Ratios:
- AB Leg: 78.6% retracement of XA.
- CD Leg: 161.8–224% extension of BC.
Trading Rules:
- Bullish Butterfly: PRZ at Point D aligns with 127.2% extension of XA and 161.8% BC extension. Common in ranging markets.
- Bearish Butterfly: Mirrors bullish structure during distribution phases.
4. The Crab Pattern
Features extreme Fibonacci extensions (224–361.8% BC), marking volatile reversals as momentum exhausts at historical swing highs/lows, often during news-driven market frenzies.
Structure: Extreme extensions for volatile markets.
Fibonacci Ratios:
- AB Leg: 38.2–61.8% retracement of XA.
- CD Leg: 224–361.8% extension of BC.
Trading Rules:
- PRZ at Point D combines 161.8% XA extension and 224% BC extension. Use tight stops due to erratic price swings.
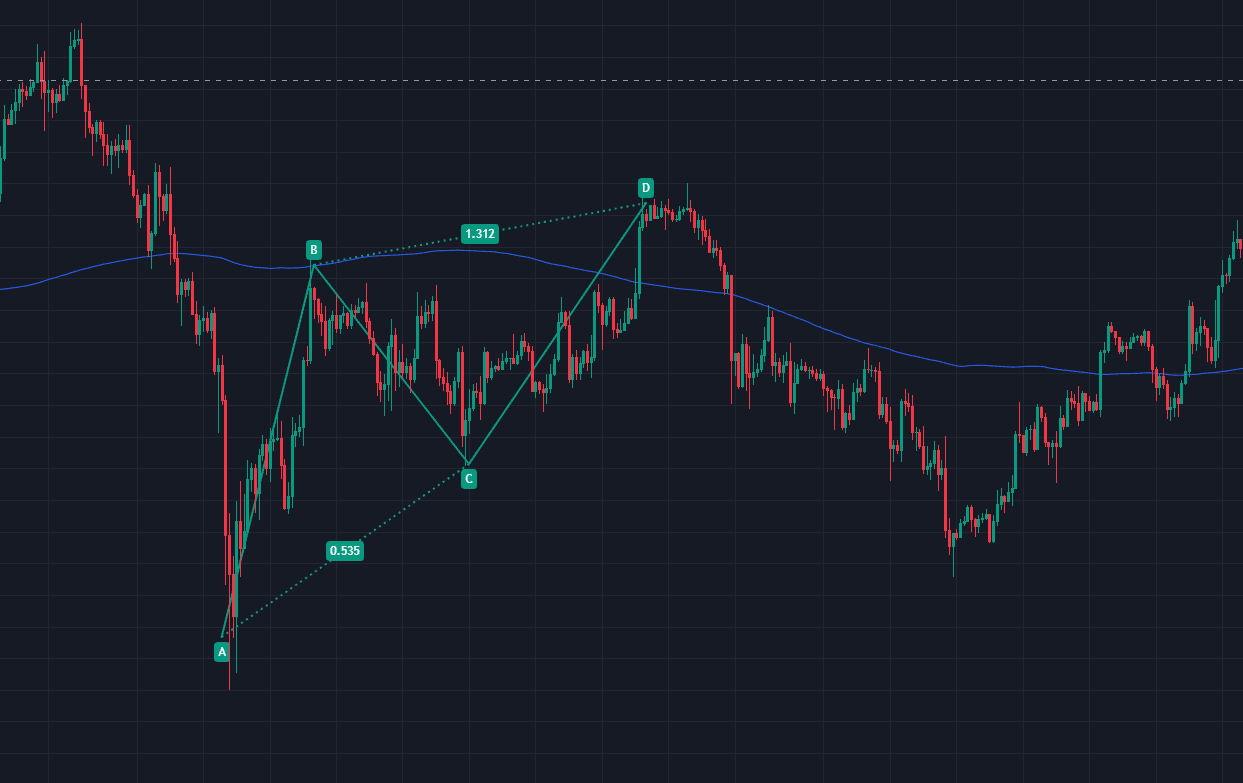
5. The AB=CD Pattern
This symmetrical structure where AB and CD legs mirror in price/time, signaling reversals as traders anticipate parity in sentiment shifts, rooted in Fibonacci symmetry.
Structure: Symmetrical legs with equal price/time ratios.
Fibonacci Ratios:
- AB Leg: 61.8% retracement of XA.
- CD Leg: 100% mirror of AB.
Trading Rules:
- Bullish AB=CD: PRZ at Point D (100% extension of AB). Confirm with RSI divergence.
- Bearish AB=CD: Inverse structure in downtrends.
An example would be Gold’s 2023 rally validated a bullish AB=CD at $1,880/oz, yielding a 7% gain.
6. The Shark Pattern
A short-term, aggressive setup with steep retracements (88.6–113% BC), forming during rapid sentiment reversals as liquidity pools trigger stop hunts.
Structure: Aggressive, short-term setup.
Fibonacci Ratios:
- AB Leg: 113–161.8% extension of XA.
- CD Leg: 88.6–113% retracement of BC.
Trading Rules:
PRZ at Point D combines 113% BC retracement and 88.6% OX retracement. Ideal for news-driven markets.
My Verdict on Harmonic Patterns
Mastering these patterns requires disciplined adherence to Fibonacci ratios and price action validation. While the Gartley and Bat patterns suit trend-following strategies, you should always use further confirmations, such as moving averages, volume and candlestick patterns to give you an edge in trading.
How to Identify and Validate Harmonic Patterns
In my experience as a forex trader, identifying and validating harmonic patterns requires a blend of geometric precision, Fibonacci rigor, and real-world discretion. Here’s my battle-tested framework to separate high-probability setups from chart noise:
Step 1: Pattern Identification
Spot the XABCD Structure:
- Begin by locating clear swing highs and swing lows on your chart. Harmonic patterns like the Gartley or Bat require five critical points (X, A, B, C, D).
- Example: In a bullish Gartley pattern, X is the start of the downtrend, A is the initial low, B is the retracement high, and so on.
Apply Fibonacci Tools
- Use Fibonacci retracements to measure pullbacks (e.g., AB leg retracing 61.8% of XA in a Gartley).
- For extensions, calculate the CD leg using Fibonacci extensions (e.g., 161.8% of BC in a Bat pattern).
Leverage Pattern-Specific Ratios
- Each pattern has non-negotiable ratios:
- Bat Pattern: AB retraces 38.2–50% of XA; CD extends 161.8–261.8% of BC.
- Crab Pattern: CD extends 224–361.8% of BC.
Step 2: Validation Through Confluence
Price Action Confirmation
- Never enter blindly at the pattern completion zone (Point D). Wait for a candlestick pattern (e.g., bullish engulfing, pin bar) to confirm momentum reversal.
Confluence with Technical Factors
- Align the potential reversal zone (PRZ) with:
- Horizontal support/resistance levels.
- Trendlines or moving averages (e.g., 200-day MA).
- Divergence in oscillators like RSI or MACD.
Multi-Timeframe Analysis
Validate the pattern across multiple timeframes. A bullish Bat pattern on the 4-hour chart gains credibility if it aligns with a weekly swing low.
Step 3: Avoid Common Pitfalls
- Overlooking the Trend Context: A bearish Gartley pattern in a strong uptrend is a trap unless supported by overbought RSI and weakening volume.
- Ignoring Ratios: If the AB leg retraces 70% of XA instead of 61.8%, it’s not a valid Gartley—it’s a flawed setup.
- False Breakouts: Use a stop loss 1–2% beyond the PRZ to filter fakeouts caused by market noise.
Step 4: Backtest and Refine
Always backtest your trading strategies regardless if you trade harmonics, candlesticks or patterns. Here are some key tips from a long time trader:
1. Historical Testing
Use tools like TradingView’s replay mode to test patterns in past markets. For example, how often did crab patterns reverse at 224% extensions during Fed meetings?
2. Track Performance Metrics
Record success rates, average risk-reward ratios, and drawdowns. In my experience, bat patterns yield 1:3 rewards 65% of the time in trending markets.
At the end of each session, keep a track record of all trades, not just your winners. At the end of each month use this data to analyse if you kept your trading checklist, if you overtraded and calculate your profit ratio. This learning is how you get more successful over the years, and is the hallmark of professional trading.
Trading Strategies Using Harmonic Patterns
After two decades of trading everything from the Gartley pattern in quiet Asian sessions to holding longs during Fed volatility, I’ve honed strategies that turn harmonic setups into consistent profits.
Let me walk you through the exact rules I live by—no theory, just battlefield-tested tactics.
1. Trend-Aligned Gartley Entries
I never trade a bullish Gartley pattern against the underlying trend. Here’s my playbook:
- Identify the Trend: Use a 200-period SMA on the daily chart. If price is above it, I only trade bullish patterns; below, I hunt bearish Gartley setups.
- Wait for PRZ Confluence: The potential reversal zone (Point D) must align with a major Fibonacci retracement (78.6% of XA) and a prior swing high/low.
- Trigger with Price Action: Enter only if a 4-hour candle closes beyond the PRZ with momentum.
2. Bat Pattern Fades for Precision Scalping
The Bat harmonic pattern is my go-to for intraday reversals. Here’s how I scalp it:
Rules:
- PRZ must include the 88.6% retracement of XA and 161.8% BC extension.
- Enter on the first pullback after PRZ rejection (e.g., a 15-minute pin bar).
- Stop loss: 1.5x the pattern’s average candle size.
- Profit target: Previous swing high/low.
3. Crab Pattern Breakout Traps
The Crab pattern thrives in chaos, but I’ve learned to tame it:
- Spot Extreme Extensions: The CD leg must hit 224–361.8% of BC. Anything less isn’t a Crab.
- Trade with the Tide: In a strong uptrend, I ignore bearish Crab patterns—they’re often fakeouts.
- Use Volatility Filters: If the PRZ coincides with a VIX spike or news event, I size down 50%.
4. Butterfly Pattern Swing Trades
The Butterfly pattern is my secret for catching multi-week reversals:
Swing Trade Checklist:
- Weekly chart shows a clear XABCD structure with CD extending 161.8% of BC.
- PRZ aligns with a monthly pivot level.
- Enter on a daily close beyond PRZ, stop loss at the pattern’s extreme.
5. Risk Management: Non-Negotiables
Managing your risk should come by default with any strategy you use, be it harmonics or regular patterns.
Here are some principles I apply as a long time professional forex trader:
- Position Sizing: I risk 1–2% per trade. Even a “perfect” Bat pattern can fail if CPI data drops mid-setup.
- Profit Targets: For Gartley and Bat patterns, I aim for 1:3 risk-reward. For aggressive Crab patterns, 1:5.
Stop Loss Rules:
- Bullish patterns: Stop below the PRZ’s swing low.
- Bearish patterns: Stop above the PRZ’s swing high.
These are just some guidelines, and every trader should review their own risk tolerance and profitability. The end goal is that your batting average and risk:reward ratios are above break even.
6. Combining Harmonic Patterns with Indicators
You can never have enough confluence when trading, and the more confirmations you can get on your side, the more likely the trade will not go against you.
I boost accuracy by layering harmonics with:
- RSI Divergence: A bullish Gartley at PRZ + RSI bullish divergence = high-probability entry.
- MACD Crossovers: A Bat pattern PRZ + MACD crossing signal line = added confirmation.
- Volume Spikes: In crab patterns, rising volume at PRZ signals institutional participation.
7. Final Tip: Patience Over Greed
Harmonic trading isn’t about frequency—it’s about quality. I’ve sat for weeks waiting for a butterfly pattern to complete, only to bag 8% in a day. Remember: Missed trades don’t deplete your accounts. Forced ones do.
Conclusion
After two decades of trading forex, harmonic patterns are among the few strategies blending art and science. Repeated events on a chart over long timeframes form all types of patterns, including harmonic patterns.
Just remember that they’re not a magic bullet, but when wielded with discipline, they offer a structured way to anticipate key turning points in the chaos of the financial markets.
Harmonic trading isn’t about perfection—it’s about persistence. Study the ratios, respect the broader trend, and treat every loss as a learning point!
FAQs
1. How accurate are harmonic patterns?
In my experience, harmonic patterns like the Gartley and Bat hit their profit targets 55–65% of the time in trending markets. However, accuracy plummets in choppy conditions or around high-impact news. Always pair them with price action and multiple timeframes for better odds.
2. Can I use harmonic patterns for scalping?
Yes, but cautiously. I scalp AB=CD patterns on 15-minute charts, targeting 10–20 pips. The key? Tight stop loss orders (1.5x average candle size) and avoiding sessions like the London-New York overlap, where market noise spikes.
3. Which pattern is best for beginners?
Start with the Bat pattern. Its rules are strict (38.2–50% AB leg retracement, 161.8% CD extension), making it easier to validate. Avoid the Crab pattern until you’ve mastered volatility management.
4. Can I automate harmonic pattern trading?
Partially. Tools like TradingView’s Harmonic Pattern Scanner or MT4’s ZUP Indicator can flag setups, but I always manually validate ratios and price action. Full automation fails because markets evolve—algorithms can’t adapt like a seasoned trader.

