As a veteran forex trader with over a decade of experience buying and selling volatile currency markets, I’ve come to realise the following: One of the most reliable tools in a trader’s arsenal are bullish candlestick patterns—graphic formations on candlestick charts that signal possible uptrends.
Based on centuries-old Japanese candlestick charting techniques, these patterns provide you as a trader with an insight into market sentiment, enabling you to predict shifts from bearish to bullish momentum.
Regardless of your level of expertise, knowledge about these patterns is essential in recognising trend reversals, validating bull continuation patterns, and making accurate choices during highly volatile market periods.
What Are Bullish Candlesticks?
In the early days of my trading life, I would always notice these definite green candles preceding climactic rallies up, or rapid bounces after a decline. In essence, candlestick patterns are graphic representations of price action during a specific trading period.
Every candlestick is a fight between buyers and sellers. A bullish candle—whereby the close price is above the open price—is evidence of buyer strength. A bearish candle? Sellers have the upper hand.
But the real edge comes from sequences like three consecutive bullish candles (the white soldiers pattern) or reversals like the morning star candlestick pattern, which I’ve seen mark the end of a downtrend countless times.
What Makes up Bullish Forex Candlesticks?
When a bullish candlestick shows up—where the closing price is greater than the opening price—it means there is strength in buying. A bearish candle means selling pressure. But the magic really begins when there are a series of bullish candles or combinations that form predictive patterns.
Each candlestick represents four key data points:
- The opening price
- Closing price
- High price
- Low price
For instance, a bullish engulfing pattern is a significant bullish reversal indication. It occurs when a tiny bearish candle is followed by a large bullish candle that completely “engulfs” the body of the initial one. This shift from selling pressure towards aggressive buying generally indicates the ending of a downtrend.
Similarly, the morning star candlestick pattern, which is a three-candle pattern that includes a bearish candle, a doji candlestick pattern demonstrating market indecision, and a bullish candle, provides a signal for potential reversal from a bearish to bullish trend.
Understanding Bullish Trends in Forex
As traders, our fortunes are tied to our ability to distinguish between bullish patterns and bearish reversal signals. In an uptrend, higher highs and higher lows reflect continued buying pressure and bullish sentiment.
Conversely, bearish trends thrive on pessimism, with declining lows and bearish candle predominance on candle charts.
Bullish vs. Bearish Trends
The psychology of these patterns is key. A bullish reversal pattern, such as the morning star candlestick pattern, will usually occur after a period of prolonged selling. This three-candlestick pattern—a bearish candle, followed by a doji candlestick pattern (which shows indecision), and then a bullish candle that closes above the midpoint of the first candle—shows a shift in market sentiment.
On the other hand, a bearish reversal pattern like the evening star candlestick pattern indicates exhaustion in uptrends where a bullish candle, followed by a doji, and a bearish candle show sellers reclaiming control.
Factors Driving Bullish Trends
While Forex candlestick patterns are powerful, they are reinforced when coupled with more ubiquitous catalysts. Bearish and bullish trends usually result from strong economic indicators, dovish monetary policies of central banks, or improved risk appetite:
For instance, when central banks signal rate cuts, growth-related currencies (like AUD or CAD) often exhibit bullish momentum signaled by three consecutive bullish candles or a bullish engulfing pattern.
Role of Technical Analysis
Since you now know patterns repeat on any chart and timeframe, it is your turn to absorb the message the chart is presenting and make an educated decision – long or short. Any pattern does not work 100% of the time, any more than any trader has a perfect win ratio.
The idea is to have your risk management such that you’re still profitable, regardless of what return you’re aiming for. Technical analysis is only half the answer, and is actually simple, once you know what patterns to watch out for and how to read individual candlesticks:
- Mastering bullish trends requires synthesising price action, market psychology, and technical discipline.
Whether you’re identifying a bullish reversal signal like the piercing line or going through market indecision with a long-legged doji pattern, context is king. - Always ask: Does this pattern align with the broader trend? Is the closing price holding above critical support?
With this out of the way I’ll show you the basics of spotting these patterns in the next segment.
Top Bullish Forex Trading Patterns
As a trader, I’ve learned that bullish candle patterns are the backbone of successful strategies. They fall into two categories: reversal patterns (showing a shift from bearish to bullish trends) and continuation patterns (confirming interruptions in ongoing uptrends).
Below are the patterns I employ most, how to spot them, and the psychology behind their success.
Reversal Patterns
These formations emerge at the end of a downtrend, marking a shift in market sentiment from fear to greed.
1. Hammer Candlestick Pattern
Identification: A small bullish candle (or bearish candle with a bullish close) with a long lower wick, appearing after a decline.
- Psychology: Sellers push prices lower, but buyers aggressively reverse the move, closing near the high.
- My Strategy: Enter long if the next candle confirms bullish momentum. Place a stop-loss below the hammer’s low.
- Key Consideration: Pair with support levels or a tweezer bottom candlestick pattern for higher accuracy.
2. Bullish Engulfing Pattern
This unusually large bullish candle completely engulfs the body of the first (smaller bearish) candle.
- Psychology: Bears lose control as buyers overwhelm sellers, often near key support.
- My Strategy: Enter on the close of the engulfing candle. Target a move equal to the height of the pattern.
- Watch For: A bearish engulfing pattern in uptrends—it’s the inverse and signals weakness.
3. Inverse Head and Shoulders
This pattern has three parts—the middle (head) is the lowest, flanked by two higher troughs (shoulders). In essence this is almost like a triple bottom where the right shoulder makes a higher low.
- Psychology: Failed bearish attempts signal accumulation before a breakout.
- My Strategy: Enter on a close above the neckline. Measure the target as the distance from head to neckline, projected upward.
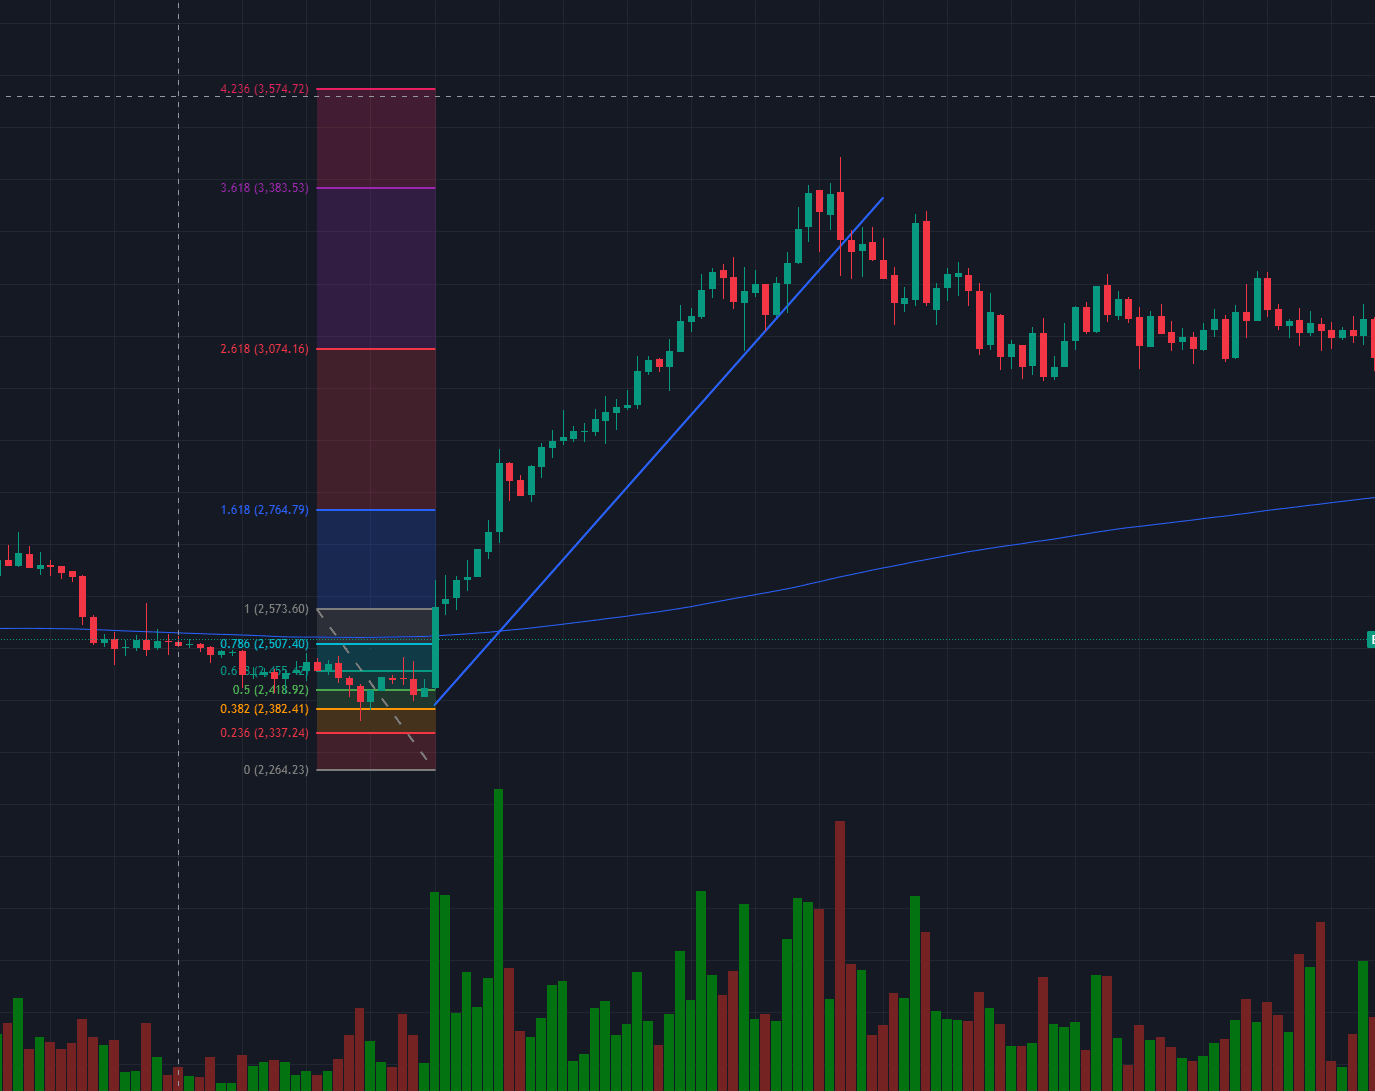
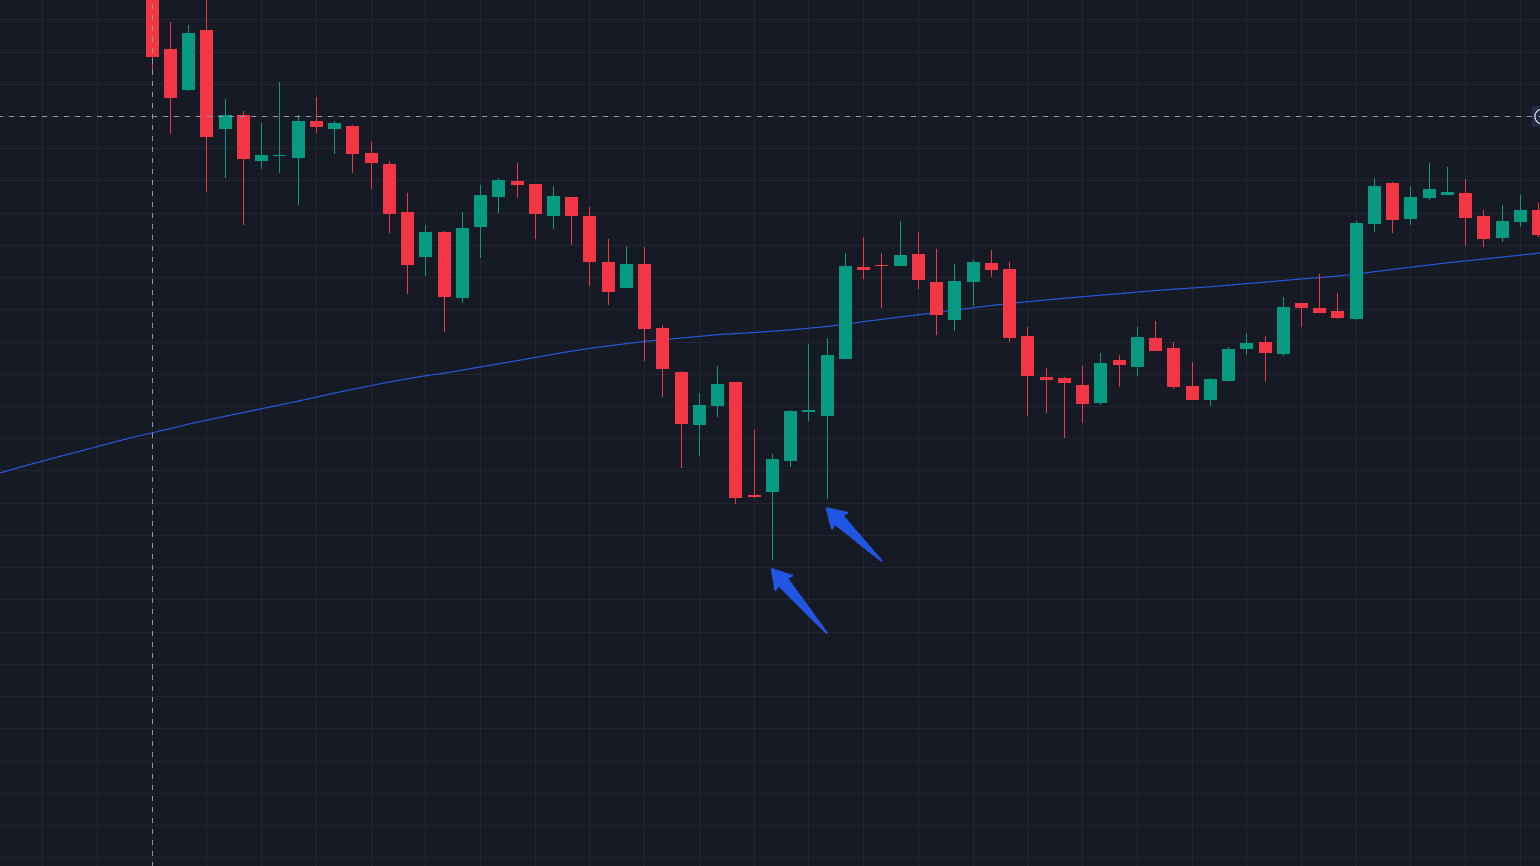
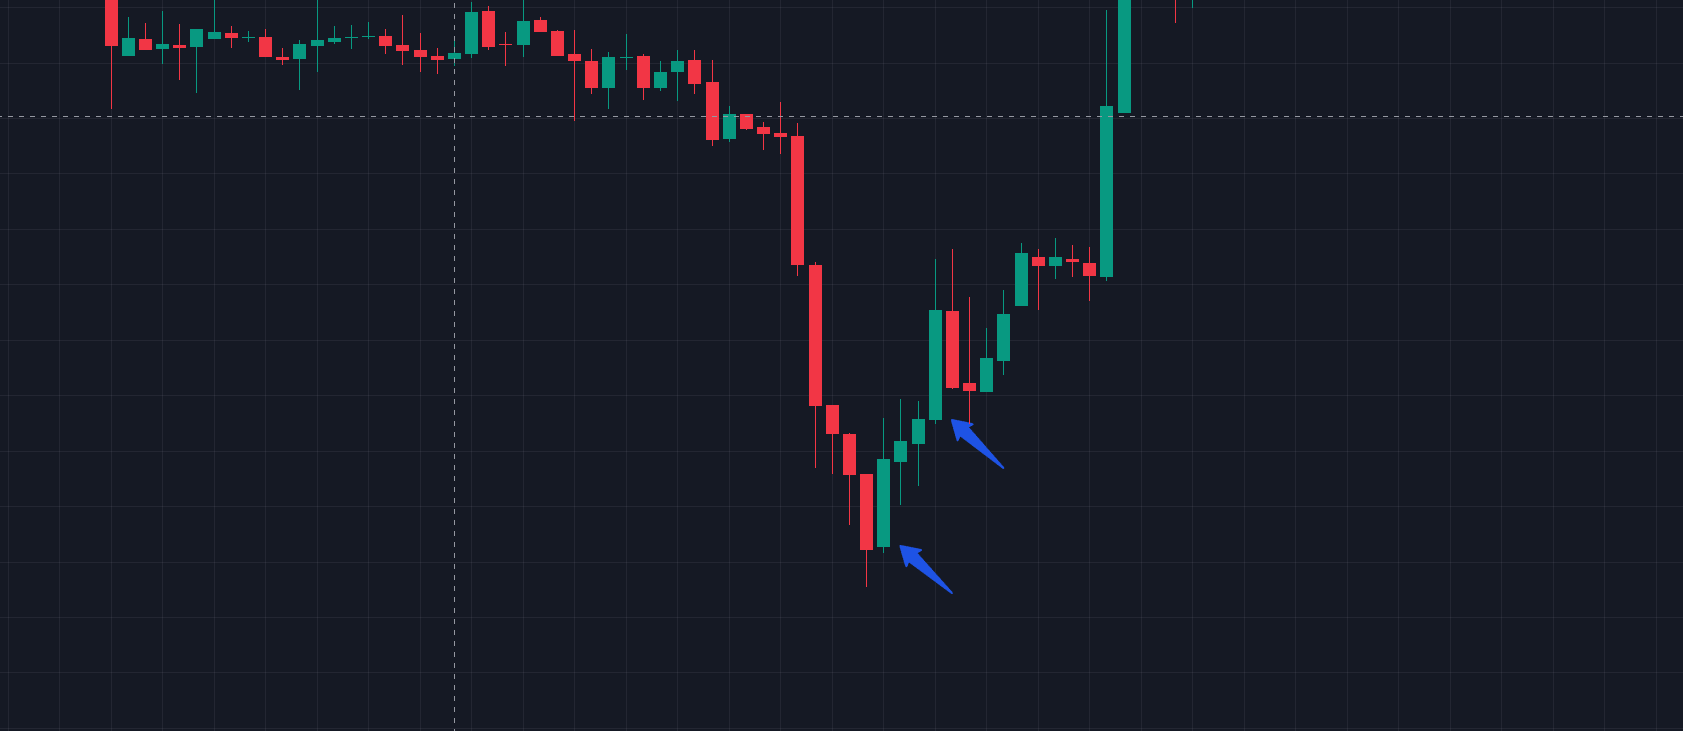
4. Double Bottom
Due to its simplicity and prevalence, the double bottom is my most traded pattern of all time. Open any chart and you will see it on every timeframe.
This pattern is best after a climactic move down, and you usually see a large bodied red candle, followed by a green doji or hammer bar:
- Identification: The key to this pattern is that after a rapid bounce, sellers attempt to break down but are stopped by buyers.
- Psychology: After forming and testing the low, traders psychologically are more inclined to pile on with longs, hence the frequent reversals upward.
- Trade setup: For extra safety, wait for the first pullback after the second bottom retest, and place the stop loss beneath the swing low.
Entering long on the first retest is extremely aggressive, with the second retest moderately risky.
My Personal Top 3 Continuation Patterns
These patterns confirm that bullish momentum is intact, offering low-risk entry points.
1. Cup and Handle
The cup and handle is another bullish pattern that has two parts, the cup – usually a long convex shape and the handle – a sharp rise to the prior high.
Here is what you need to know:
- Identification: A U-shaped “cup” followed by a slight dip (“handle”) near the cup’s rim.
- Psychology: Long-term accumulation precedes a breakout.
- My Strategy: Buy on a close above the handle’s high. Target a move equal to the cup’s depth.
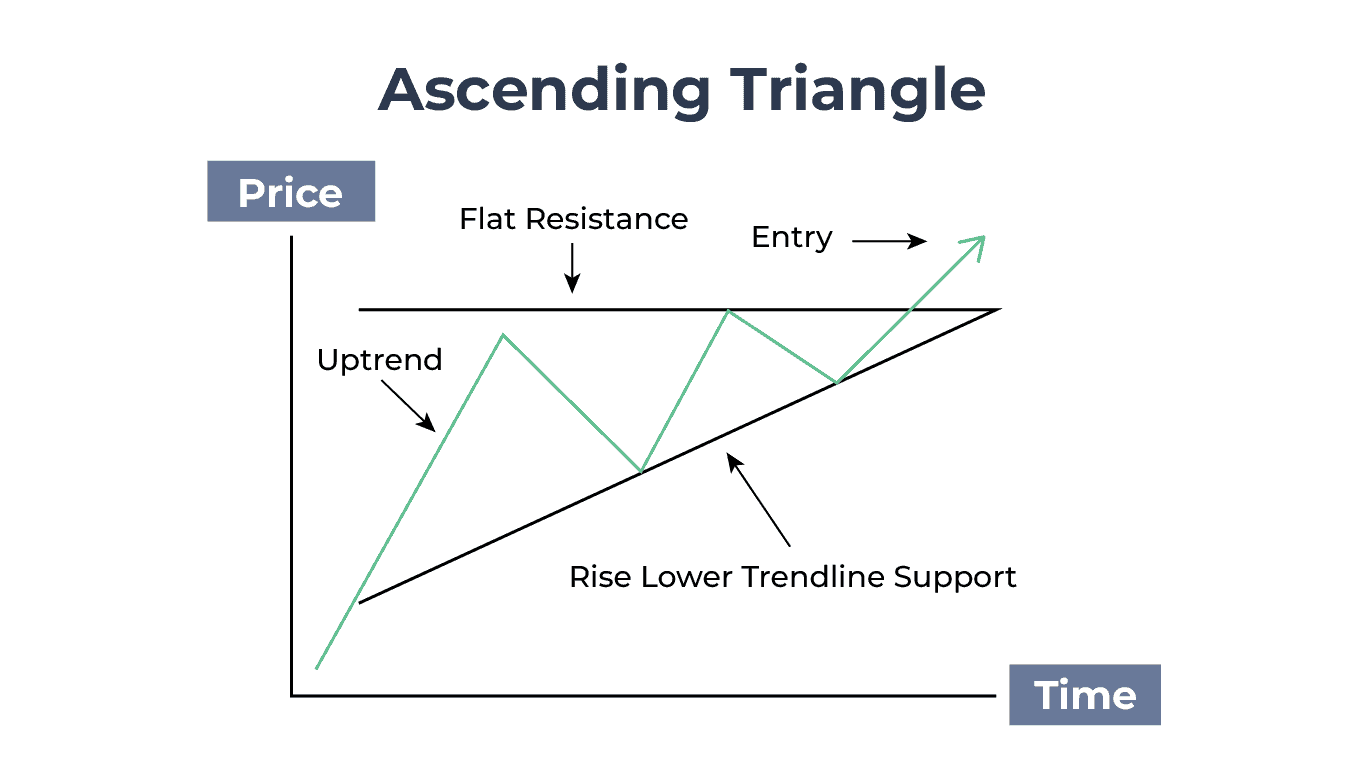
2. Ascending Triangle
The ascending triangle is one of the best bullish patterns, as it occurs after an uptrend, so you already have the right market bias. A break usually signals your entry, with the stop loss placed beneath the swing lows.
Here is how I trade this pattern:
- Identification: A horizontal resistance line and rising trendline of higher lows.
- Psychology: Sellers defend a price level, but buyers grow stronger with each dip.
- My Strategy: Enter on a breakout above resistance. Use the triangle’s height to set profit targets.
3. The Bullish Flag/Pennant
The bullish flag/pennant looks remarkably similar to an ascending triangle, the difference being its geometry. The principle is the same, price remains high after a bullish rally and rests for its next leg up, forming a bullish flag.
Here are the basics on this pattern:
- Identification: A sharp rally (flagpole) followed by a small consolidation (flag/pennant) with consecutive bullish candles.
- Psychology: Profit-taking pauses the trend, but buyers quickly resume control.
- My Strategy: Buy on a breakout above the flag’s upper trendline. Target a move equal to the flagpole’s length.
Whichever pattern you pick, always ask yourself the questions: Does the closing price hold above key moving averages or support and is this pattern aligned with the higher timeframe trend?
Using Bullish Patterns In Tandem With Technical Indicators
As a trader, I’ve learned that bullish candlestick patterns alone are insufficient to ensure success. They’re like a high-performance engine—but without proper fuel (confirmation from indicators), they won’t work.
Over the years, I’ve developed a system combining these patterns with technical tools to filter out noise, confirm setups, and increase my win rate. Here’s how I do it.
My Take on Using Moving Averages
Moving averages (MAs) smooth out price noise, helping traders distinguish genuine bullish reversal patterns from false signals.
My Strategy:
- Use a 50-period SMA (Simple Moving Average) or 20-period EMA (Exponential Moving Average) to gauge the broader trend.
- Look for bullish engulfing patterns, morning star formations, or hammer candles near these MAs.
- Enter only if the closing price holds above the MA, signaling alignment with the trend.
Example: A bullish harami pattern forming above a rising 50 SMA suggests the pullback is over, and bullish momentum is resuming.
Pitfall to Avoid: A bullish engulfing candlestick pattern below a declining MA often fails—it’s counter-trend. Wait for the MA slope to flatten or rise.
Using the Relative Strength Index (RSI)
RSI identifies overbought/oversold conditions, adding context to bullish reversal signals.
Trading Strategy:
- After spotting a hammer or inverted hammer candlestick pattern at the end of a downtrend, check if RSI is below 30 (oversold).
- A bullish divergence (price makes lower lows, RSI makes higher lows) paired with a bullish reversal pattern (e.g., piercing line) is a strong buy signal.
- Avoid entries if RSI is overbought (>70) during a continuation pattern like a bullish flag—it hints at exhaustion.
Example: A morning star doji pattern with RSI divergence? That’s my cue to go long.
Volume Analysis – Riding Institutional Commitment
Volume verifies whether the bullish candlestick patterns are confirmed by institutional demand. While we don’t have normal volume in forex as in stocks or commodities trading, you can still look at an order book and use the fundamentals:
My Strategy:
- For bullish engulfing or three consecutive bullish candles, ensure volume spikes on the breakout candle.
- Low volume during a bullish harami pattern? It’s likely a fakeout—wait for confirmation.
- In continuation patterns (e.g., ascending triangle), rising volume on the breakout confirms bullish momentum.
Pro Tip: Volume should always expand in the direction of the trend. A bullish engulfing candlestick pattern with weak volume is like a car without gas—it won’t go far.
My Golden Rule for Indicators: Less Is More
Early in my career, I overloaded charts with indicators, mistaking complexity for sophistication. Now, I stick to 1-2 tools per setup. For instance:
- Bullish engulfing + RSI divergence = High-confidence reversal.
- Morning star + 50 SMA support = Trend-aligned entry.
You can try and experiment with any indicator you like, paid or free, remember that the fundamentals are price action and volume, the rest is only there for further confirmation.
Risk Management Strategies
No matter how beautiful your bullish candlestick patterns are, trading without risk management is navigation without a compass—you will always capsize.
Over the years, I have seen traders execute perfect entries using bullish engulfing patterns or morning star formations and blow accounts by losing discipline.
All trades begin with setting risk. For bullish reversal patterns, I set stops below significant levels:
- Hammer/Inverted Hammer: Below the candle’s low.
- Bullish Engulfing: Below the engulfed candle’s low.
- Inverse Head and Shoulders: Below the right shoulder’s trough.
- Double Bottom Retest: Below the first pullback low.
- Wedge/Flag Patterns: Bellow the wedges swing low, or second pullback.
Stops tie your risk to the structure of the pattern. If a bullish harami pattern doesn’t work and the close price crosses your stop, it means the setup was a dud.
Pro advice: Record every trade—successful bullish reversal patterns, failed bearish misreads—to hone your edge.
Position Sizing
Even the strongest bullish reversal signal will fail. My principle: Risk ≤2% of my account for each trade. If you are a beginner trader, I’d even suggest risking no more than 1% per trade, so you have room for errors while still maintaining your deposit.
Here’s the math:
- If my stop is 50 pips away on EUR/USD, and I risk 200(2200(210k), my position size = 200/50 pips = 200/50 pips=4 per pip (0.4 lots).
- Always adjust size based on volatility. A bullish flag in a choppy market? Reduce position size—widely swinging opening and closing prices increase risk.
Even if only 50% of your bullish candlestick patterns win, a 1:2 ratio keeps you profitable long-term.
I never enter a trade unless the potential reward outweighs the risk by at least 1:2. For example:
- Morning Star Pattern: If my stop is 30 pips, my target is 60+ pips.
- Ascending Triangle: Measure the pattern’s height and project it upward from the breakout.
You might have heard some suggestions such as letting your winners run, or vice versa, but this is make-believe because no one knows the future. If a bullish engulfing candlestick pattern hits your target, take profits. Greed turns winners to losers.
Pro Tip: If you are looking for TA-based entry and exit points, I recommend trying out Fibonacci indicators and other harmonic patterns to offer structured take-profit points.
Common Mistakes to Avoid
Even the most reliable bullish candlestick patterns can lead to losses if traders fall into these traps. Over my time as a professional forex trader, I’ve made—and seen others make—costly errors that stem from haste, overconfidence, or misreading candlestick charts.
Here’s how to sidestep the most common pitfalls:
Too Aggressive Bullish Entries
My initial mistake was the confusion of a bullish harami signal as a definite reversal. A tiny bearish candle inside a larger bearish candle seemed hopeful, but I entered before the following candle confirmed the reversal.
Result? The trend continued downwards, and I took an unnecessary hit.
The fix is to wait until the close of the next candle to validate the pattern. For example, a bullish engulfing candlestick pattern isn’t validated until the engulfing candle closes solidly.
Ignoring Higher Timeframes
A hammer candlestick pattern on the 15-minute chart once lured me into a long position. But the daily chart showed a strong bearish reversal signal (an evening star doji pattern). Ignoring the higher timeframe’s downtrend, I lost 3% in hours.
Always check the weekly/daily chart! A bullish reversal pattern on the 1-hour chart means little if the monthly trend shows a bearish pattern.
Chasing Every Pattern – Overtrading
In my first year, I’d trade every bullish candle, from three consecutive bullish candles to minor spinning top candlestick patterns. This led to exhaustion, diluted focus, and inconsistent results.
Not all trades are made equal, and if you are going to risk your hard earned resources, you want to take only the best setups. Focus only on high-probability setups. A bullish engulfing pattern at a key support level? Worth it. A small bullish candle in a choppy market? Skip it.
Conclusion
As you trade along, keep in mind this: bullish candlestick patterns are your ally, but only as powerful as the trader employing them.
You will never be fully in control of bullish candlestick patterns. Start by practicing on historical
charts—spot three consecutive bullish candles, identify piercing line patterns, and analyse bullish engulfing candlestick patterns in different market conditions. Over time, you’ll develop an intuition for when to act and when to wait.
Keep in mind, trading is not about being perfect—it’s about being consistent. The greatest traders lose, it’s the ones who can control risk, learn from losses, and remain disciplined that distinguish themselves. Whether trading a morning star candlestick formation or a bull flag, allow patience and strategy to direct your actions.
FAQs
1. What’s the Difference Between a Bullish and Bearish Candlestick?
A bullish candle has a closing price higher than its opening price, signaling buyer dominance. A bearish candle has a closing price lower than its opening price, indicating seller control.
2. How Do I Use Bullish Patterns with Indicators?
Combine bullish candlestick patterns with tools like:
- Moving Averages: A hammer near a rising 50 SMA is more reliable.
- RSI: A bullish engulfing pattern with RSI divergence signals strong momentum.
- Order Book Volume: A bullish flag breakout with rising volume confirms the move.
3. What Are the Most Reliable Bullish Patterns?
My go-to patterns include:
- Double Bottom: Bulls taking control after a retest
- Bullish Engulfing: Strong reversal signal near support.
- Morning Star: Reliable trend reversal after a downtrend.
- Inverse Head and Shoulders: High-probability reversal with clear targets.
- Bullish Flag: Excellent continuation pattern in strong uptrends.


Ask an Expert