What Are Forex Candlestick Patterns?
Forex candlestick patterns are specific price formations which occur on currency graphs, suggesting likely market direction. These forecastable shapes—triangles, flags, head-and-shoulders—aren’t arbitrary; they reflect trader psychology and sentiment.
These formations are required by traders because they:
- Provide objective point of entry and point of exit
- Signal possible reversals before they happen
- Supply statistical probability for the result of trade
- Help set correct stop-loss levels
Each pattern tells a tale—whether of accumulation into a breakout or exhaustion into a reversal. In this guide, I’m going to show you how I identify and trade these patterns for consistent returns in my own trading.
Why Chart Patterns Matter in Forex Trading
Charts are an easy way to visualise metrics such as price action and volume of different assets, commodities or currency pairs. This insight is important, as over time patterns reappear and your goal as a trader is to use past price action to gain a small edge on the market.
Over the years, I’ve learned that these patterns aren’t just random shapes but reflections of human psychology.
Here are the basics of what drives price action and forms green and red candles:
- When traders are driven by fear, sellers are in control and the price goes down.
- When buyers step in, traders get greedy as nobody wants to sell, driving prices up.
As a retail trader, you should know that large-volume players (hedge funds, banks) often create patterns before major price movements. As retail traders, we aim to ride the wave of commitment from larger entities.
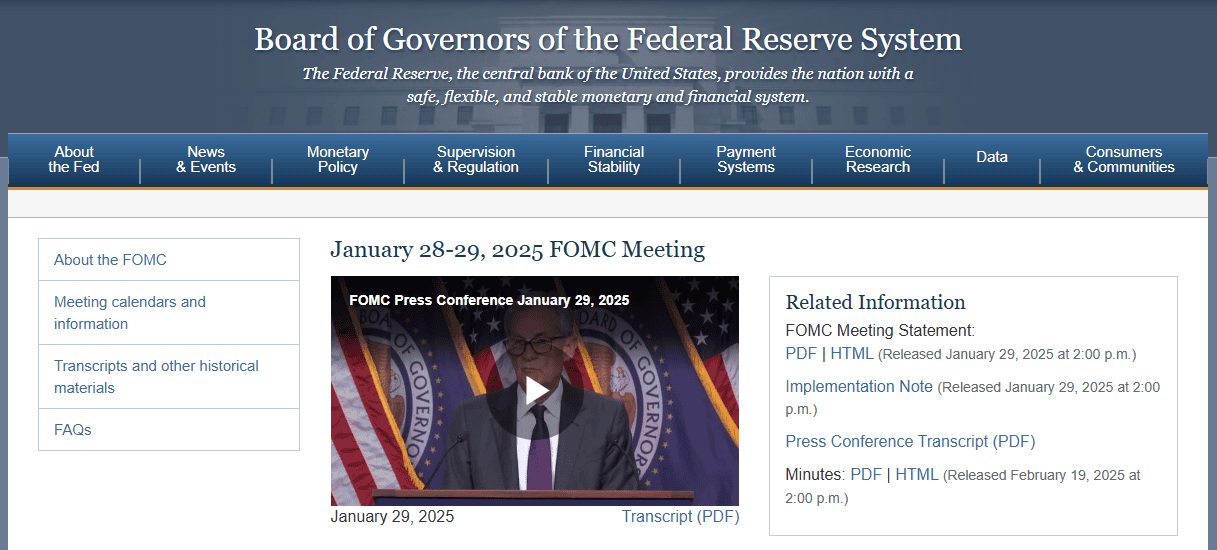
Price in forex pairs is also tied to broader geopolitics, financial news or major events. Entering traders on currency pairs before major announcements such as the Consumer Price Index, inflation and even global liquidity.
The Best Way to Analyse the Forex Market
The best way to track the price movements of your favourite currency pair is through live forex charts. There are many alternatives to keep up with the most recent price moves in the forex market.
The best free forex charting software for analysing live charts are:
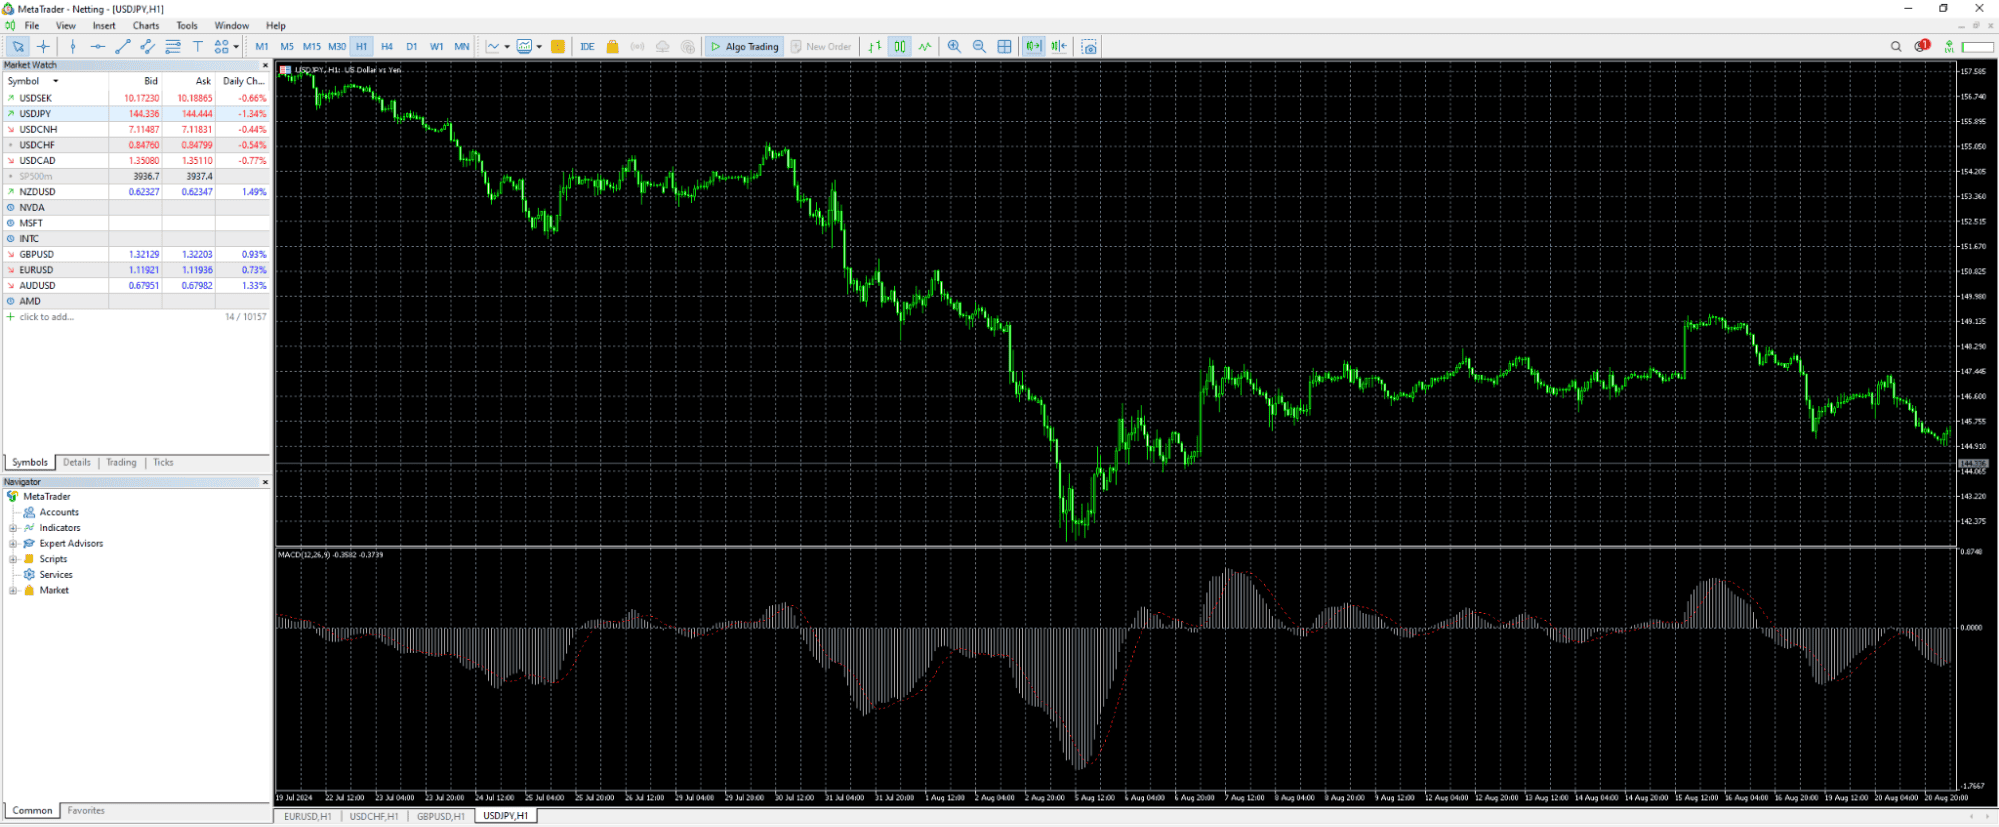
- Best MT4 Brokers (MT4) trading platform – with a user-friendly interface and easy-to-follow instructions
- Best MT5 Brokers (MT5) trading platform – complete charting solution for forex trading and CFDs
- Best cTrader Brokers– has an interactive graphical interface
- Best TradingView Brokers – delivers a highly customisable charting package

Candlestick Charts: Anatomy of a Candle (Body, Wicks)
As mentioned earlier, candlesticks are a visualisation of price action over a given time frame. Each candle has two parts, the body and a wick:
Here is a quick breakdown:
- The body of the candle (the thick part) shows the range between the open and close prices.
- If the close is higher than the open, the candle is typically colored green (or white), indicating a price increase.
- If the close is lower than the open, the candle is colored red (or black), indicating a price decrease.
- The thin lines above and below the body are called wicks. They represent the high and low prices during that time period.
Before moving onto the actual forex patterns, let’s briefly go through the anatomy of individual candles, as this plays a major role in pattern formation and identifying good trade entry points.
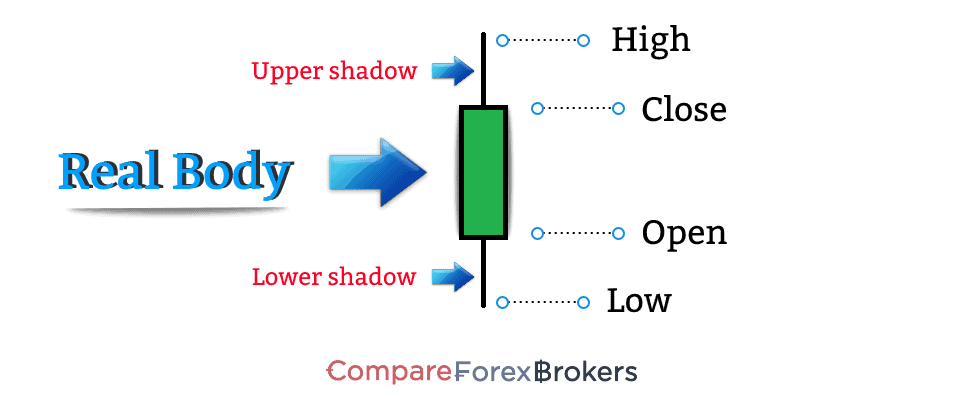
The body of a candle is the rectangular portion representing the opening and closing prices during a specific timeframe (e.g., 1 hour, 1 day).
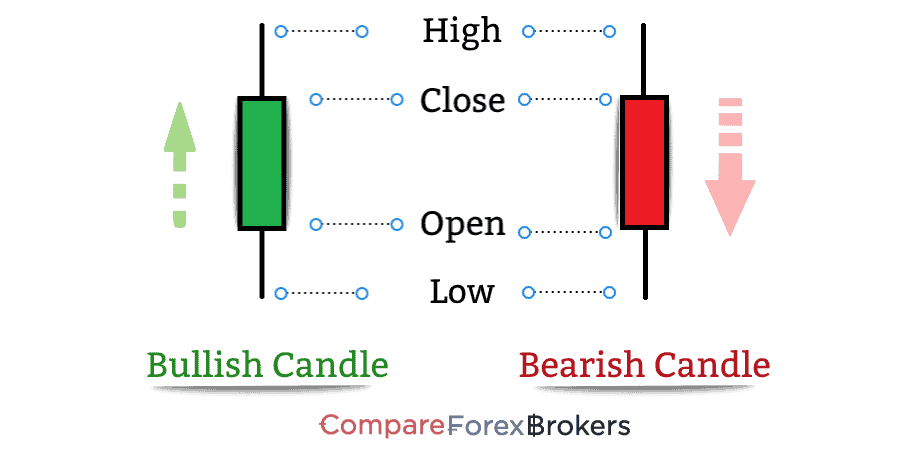
- Bullish Candle (Green): Close > Open. Indicates buying pressure.
- Bearish Candle (Red): Close < Open. Signals selling pressure.
- A large body shows strong momentum; a small body is less indicative.
The body tells you who’s in control—bulls or bears. A series of large bullish bodies in an uptrend confirms conviction while shrinking bodies warn of exhaustion.
The Wicks are the thin lines above/below the body, showing the highest and lowest prices during the timeframe.
- Upper Wick or topping tail: Rejection of higher prices. A long upper wick in a bullish trend signals resistance. Buyers got exhausted and bears drove the price down, showing exhaustion of bullish momentum.
- Lower Wick or bottoming tail: Rejection of lower prices. A long lower wick in a downtrend suggests support. Sellers tried their best, but prices got back up, showing strength from buyers.
Short Wicks indicate that the price is closed near its high/low and is usually less useful than more pronounced Wicks.
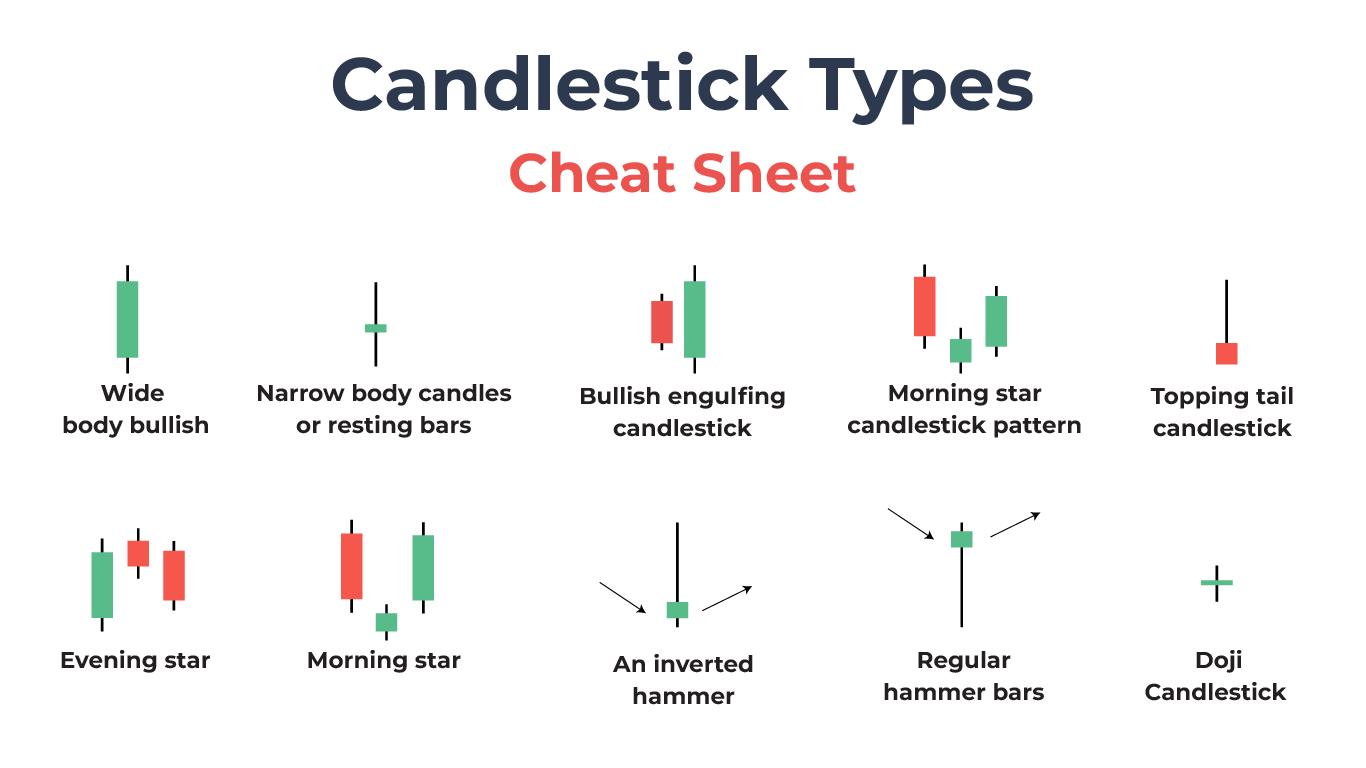
Candlestick Types – Cheat Sheet
Before I show you all of the forex chart patterns, it’s best to get familiar with reading individual candles, as they tie in to reading price action:
- A wide body bullish candle indicates strong upward momentum, and a bearish wide body candle indicates strong bearish sentiment. The position and context of these candles matters a lot.
- Narrow body candles or resting bars indicate low volume or volatility. Seeing three consecutive narrow bullish candles after a rapid move up or down means the price is “resting” and getting ready for the next leg up. An analogy is that after you run a marathon, you can’t expect to run another one right away.
- A bullish engulfing candlestick occurs after a candlestick “engulfs’ the prior red candlestick. This pattern signals potential upward momentum when a larger green candle fully “engulfs” the previous red candle and vice versa.
- The morning star candlestick pattern, featuring a short candle between two opposing larger ones, often marks a bullish reversal.
- A topping tail candlestick, or also known as a candle with a long upper shadow, suggests buyers lost control after an intraday rally.
- The evening star, a shooting star candlestick pattern, appears on local or cycle tops, often between a wide-body green and wide-body red bar. It signals a bearish reversal signal, often following a downtrend.
- A Morning star candlestick is the opposite of an evening star, and instead indicates a bullish reversal. If the morning star appears at the top of a large move upward and closes red, it’s called a hanging man candle, and instead becomes bearish.
- An inverted hammer or topping tail bar happens after an uptrend, and signals that sellers may soon dominate. If it happens at the top of climactic move, it’s even more potent and a great place to short with a stop loss above its wick.
- Regular hammer bars or dragonfly bars happen after rapid price crashes and are most potent if they form a double double or triple bottom near prior support levels. Look for long entries if there are further confirmations.
- A doji candlestick pattern reflects market indecision, with opening and closing prices nearly identical. These bars make for great support or resistance levels, showing that the buyers and sellers were locked in a fierce tug of war at that price level.
Some traders might have different names for these candlesticks, but the idea is that you know how they look so you can spot them. Naming isn’t as important as understanding why and where they occur. It’s not good practice to enter trades based on just a single bullish or bearish candle.
Reversal vs. Continuation Patterns: Key Differences
Candlestick patterns are broadly categorised into reversal patterns (signaling a potential trend reversal) and continuation patterns (indicating the existing trend will resume).
Reversal Patterns
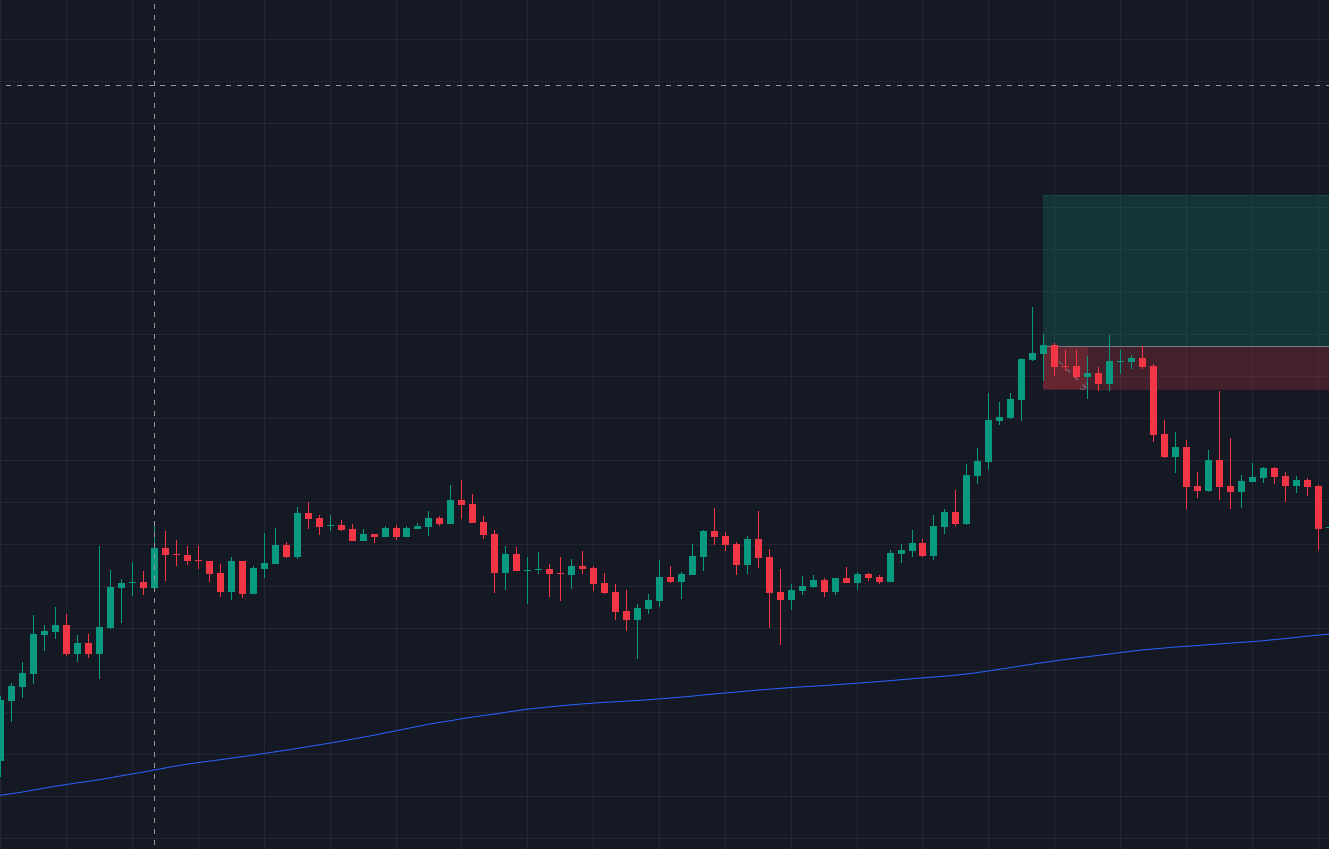
Reversal patterns are critical technical analysis tools that indicate a potential shift in market sentiment and price direction. For instance, when I see a morning star candlestick pattern like in the image below after an uptrend, I know a bearish reversal pattern might be brewing.
Notice in the image of the reversal pattern that there is a wide body green bar at the top. This wide body is often called an ending volume candle and signals buyer exhaustion, especially after an already prominent move up.
In this example, the three candles at the top form a triple top, featuring an evening star in the middle. When you trade, you should look for multiple confirmations to align with your bias.
Continuation Patterns
On the other hand, continuation patterns, such as bullish pennants or ascending triangles, suggest that the current trend will resume.
I remember a trade where I spotted a bullish harami candlestick pattern during an uptrend. Instead of exiting, I held my position, and the trend continued, rewarding my patience.
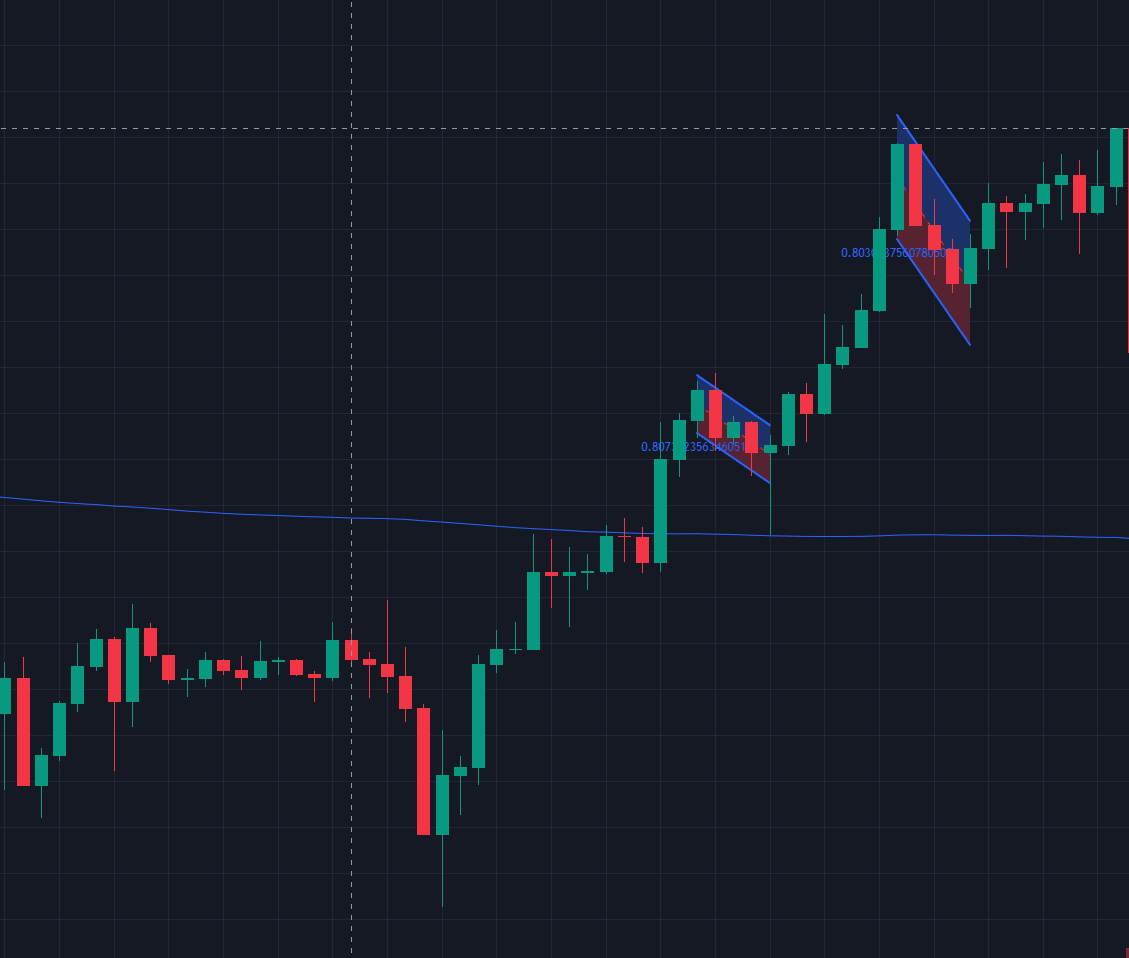
Notice in the image above how there is a clear uptrend, but then the price pulls back with a bullish hammer bar leaving a long wick. This occurrence would be a good place to add to your trade, as it signals the continuation of the move higher.
Key Differences
- Location: Reversal patterns form at trend extremes (peaks/troughs), while continuation patterns occur mid-trend.
- Confirmation: Reversals require validation (e.g., a third candle closing in the new direction), whereas continuation patterns rely on consolidation (e.g., trading periods with tight ranges).
- Shadows & Bodies: Reversals often feature long upper/lower shadows (e.g., Shooting Star), while continuation patterns may show smaller shadows and aligned bodies.
The key with patterns is context and how they happen. A bearish engulfing pattern at the top of an uptrend is a strong bearish reversal signal, but the same pattern in the middle of a range might not be as significant. Always consider the bigger picture.
Can You Use Price Action for Scalping or Day-Trading?
Absolutely. Price action, especially candlestick patterns, is my go-to tool for both scalping and day trading. When I’m scalping, I focus on short-term patterns and I also use support and resistance levels to confirm entries and exits.
When swing trading, or spot trading over periods of weeks, months or even years, you still want to use some basic technical analysis. If you are building a long-term investment such as index funds, you will likely have recurring bids or buy orders every month, reducing the need for chart analysis.
But even in long-term trends, you can still leverage your knowledge.
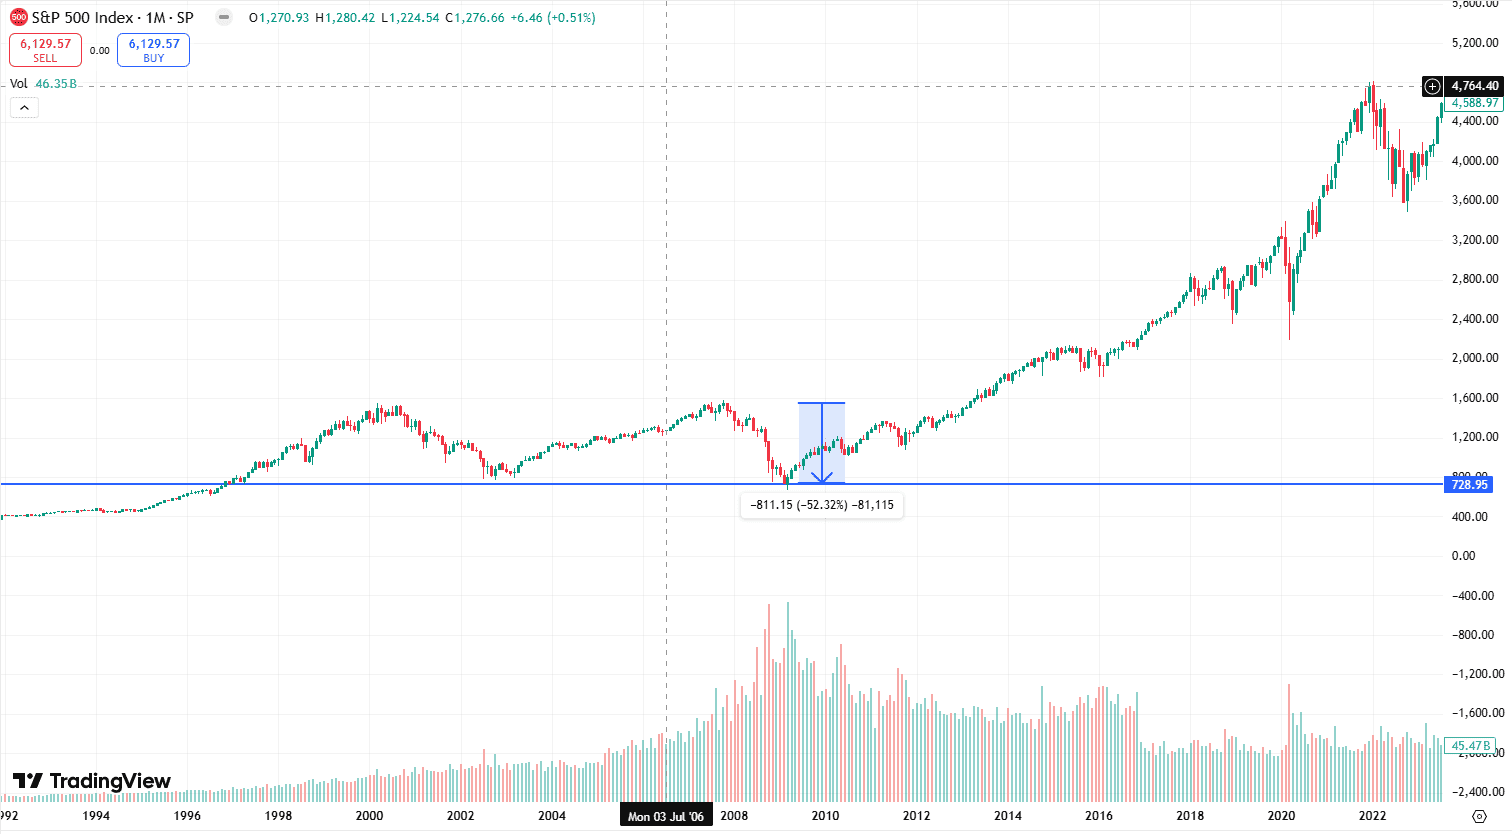
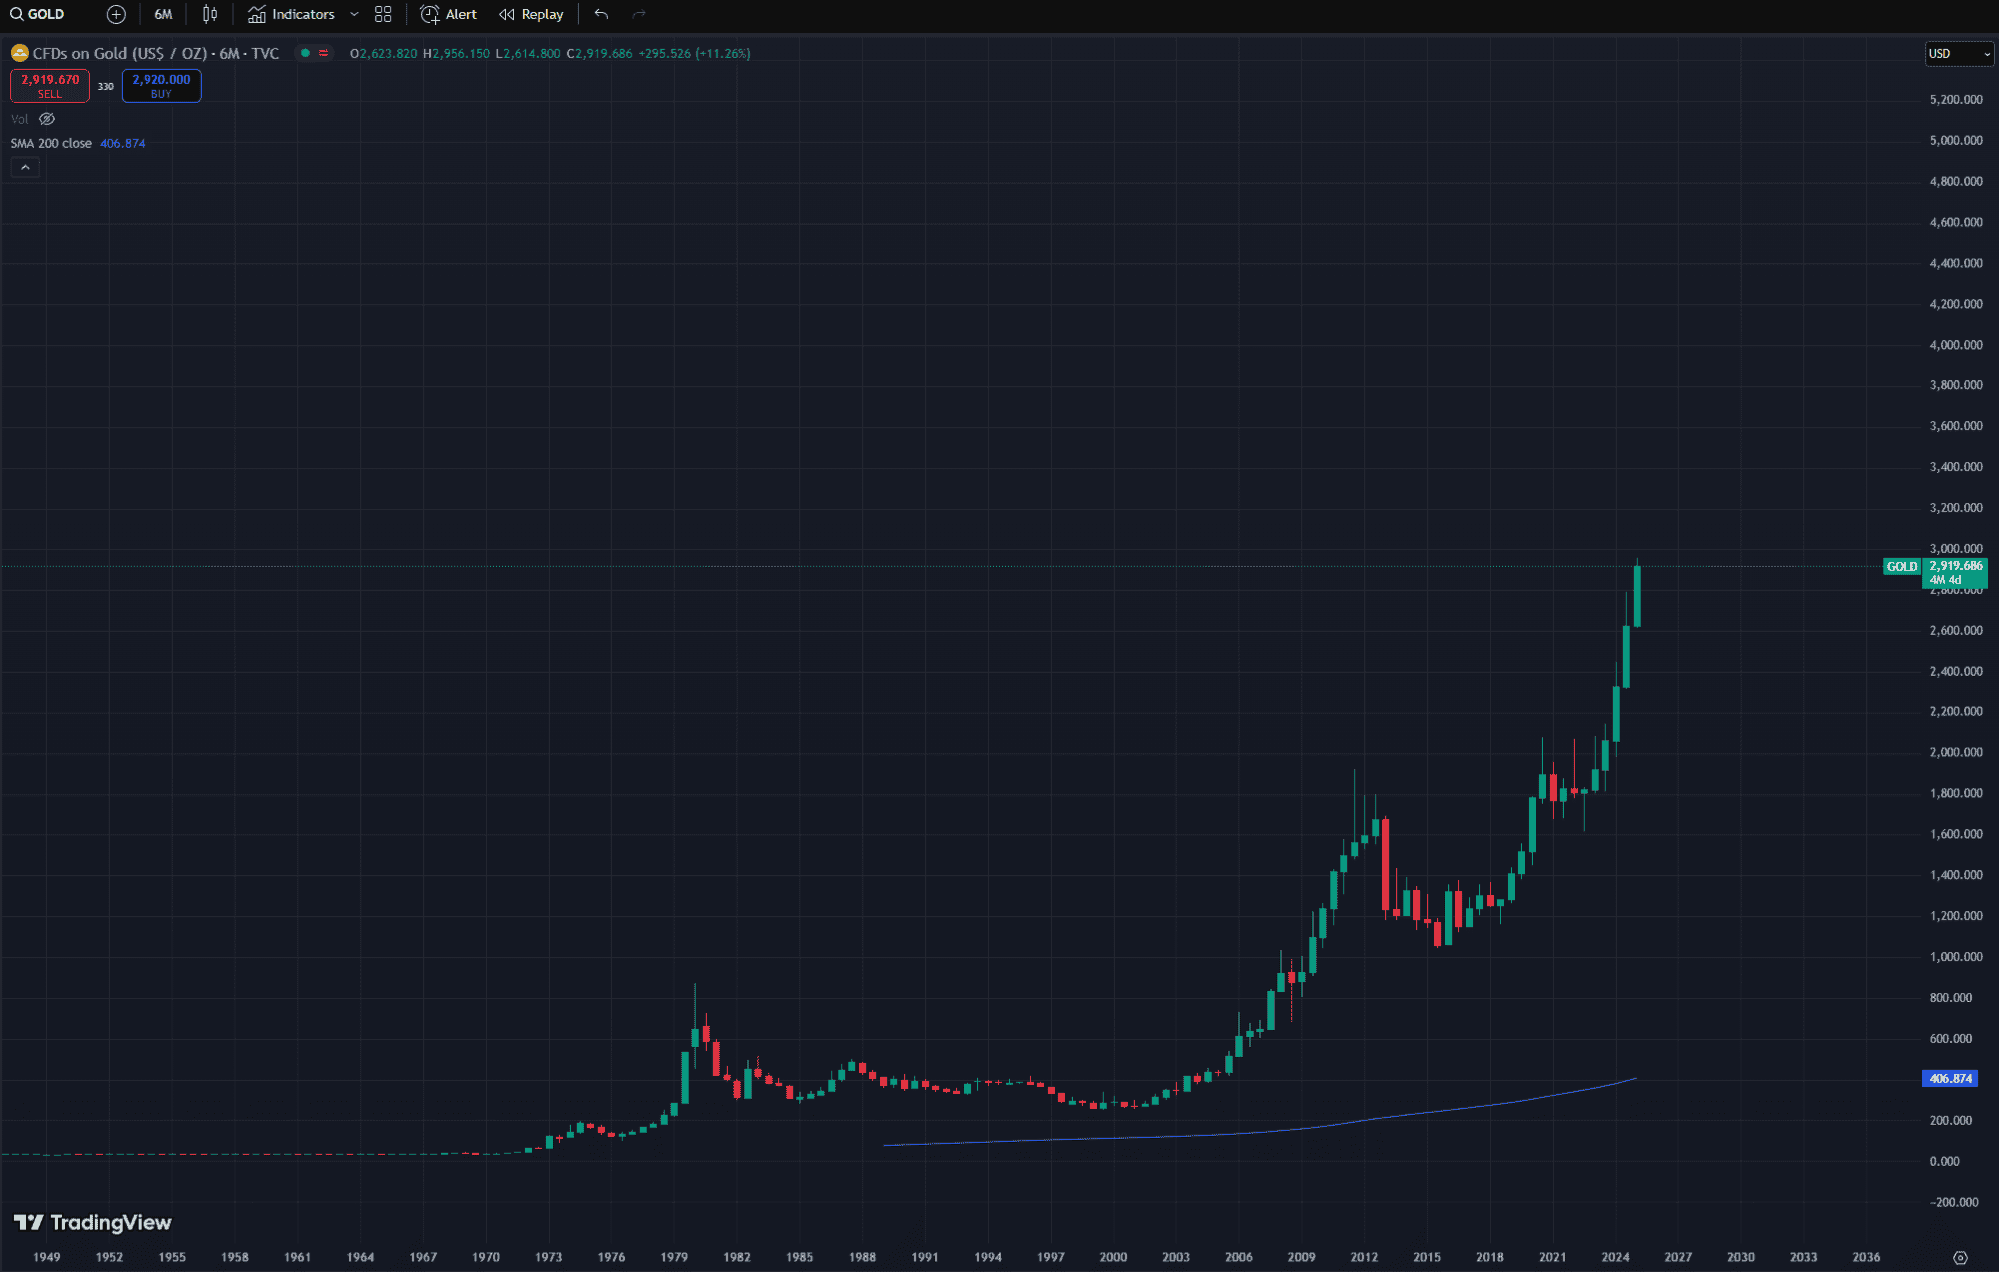
If you take a look at the crash during 2008, you can see a sudden drop of roughly 50%. Since every transaction must have a buyer and a seller, this crash means people were SELLING with the highest volume, at the lowest point.
With such a rudimentary technical analysis, you should have been loading up capital to get an entry after such a dip. You can even see that the 2008 pullback went to the prior support level. The point is that you can absolutely use TA for long-time trading.
Most Reliable Forex Chart Patterns (With Examples)
Forex chart patterns are the language of market psychology, revealing shifts in supply and demand.
While no pattern is foolproof, these seven setups have consistently delivered high-probability trades for me when paired with trend alignment and momentum confirmation:
1. Head and Shoulders (Reversal)
This bearish reversal pattern forms after an uptrend, featuring three peaks: a higher peak (head) between two lower ones (shoulders). A neckline connects the swing lows.
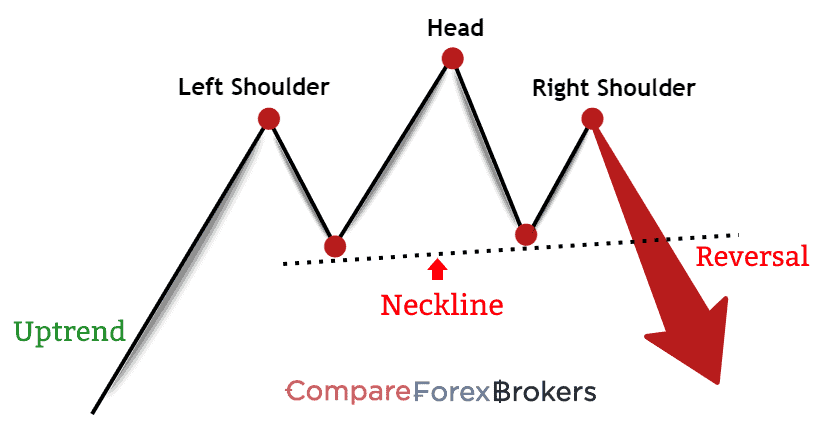
- How to Trade: Enter a short position when the price breaks below the neckline. Place a stop-loss above the right shoulder. Take profit at a distance equal to the head’s height from the neckline.
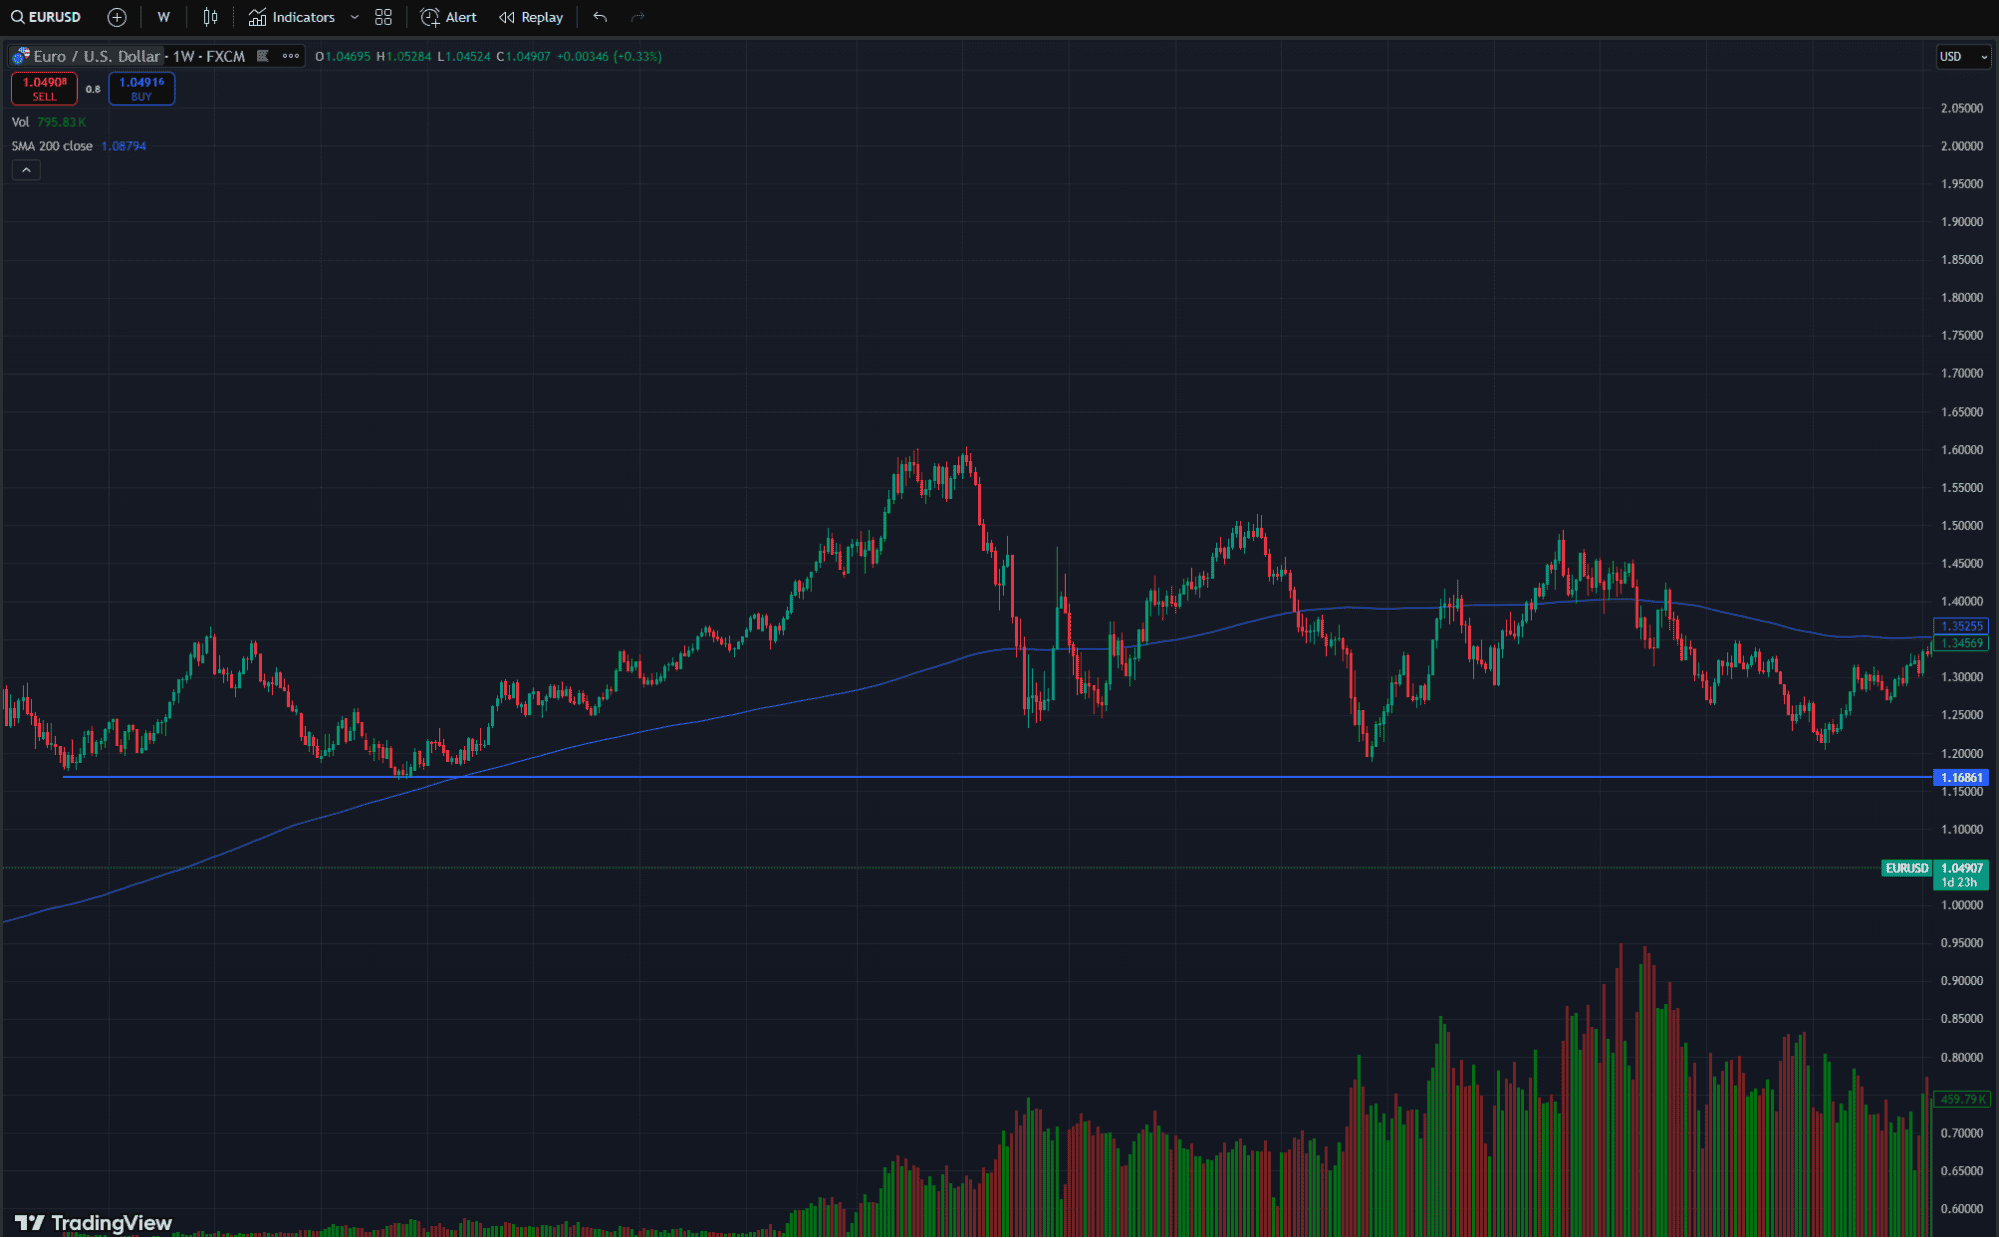
- Example: EUR/USD forms a head and shoulders after a rally, breaking the neckline at 1.1200. Target: 1.1000; Stop-loss: 1.1300. Always confirm with high volume on the breakout for reliability.
- Candlestick bars that add confirmation: Look for evening star candles at the left shoulder, head and right shoulder. Look for a wide body bearish candle that breaks through the neckline.
- Trend invalidation signs: If you spot a bullish engulfing candlestick pattern that goes up to the right shoulder, you are likely seeing a fixed range and not a reversal.
2. Inverse Head and Shoulders (Reversal)
Description: A bullish reversal pattern with three troughs: the middle (head) is the lowest. The neckline connects swing highs.
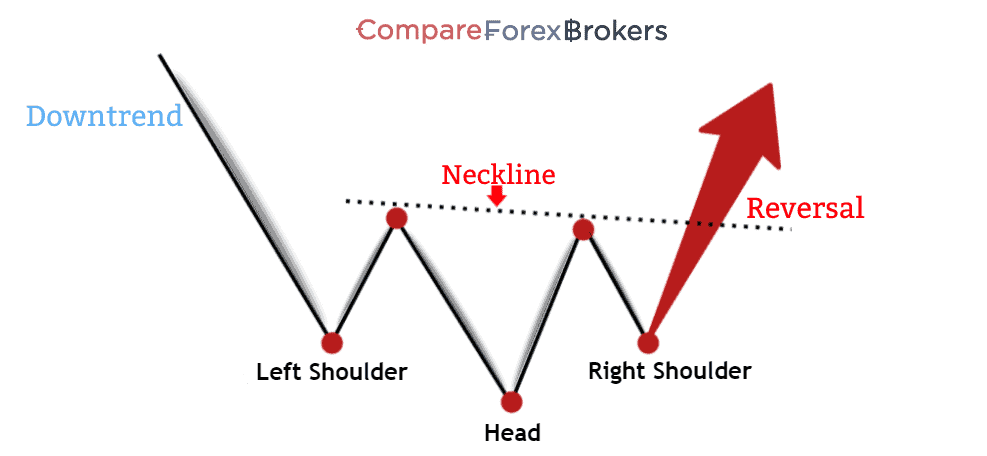
- How to Trade: Buy when price breaks above the neckline. Stop-loss below the right shoulder. Target equals the head’s height.
- Example: GBP/USD rebounds from 1.3000, breaking the neckline at 1.3200. Target: 1.3400; Stop-loss: 1.3100. A good tip is to look for RSI divergence to confirm momentum shift.
- Candlestick bars that add confirmation: Look for bottoming tail bars near the head or right shoulder. A wide body candle breaking through the neckline resistance followed by narrow range resting bars is extremely bullish.
- Trend invalidation signs: Inverted hammer candlestick patterns that appear after the break signal that the price is likely going further down. Look for entries on lower support levels.
For traders seeking additional confirmation, combining this pattern with harmonic patterns, which use Fibonacci ratios to pinpoint reversal zones can increase the reliability of your setup.
3. Double Top and Double Bottom (Reversal)
This pattern is two peaks at the same resistance after an uptrend. Breach of the support (neckline) signals bearish reversal.
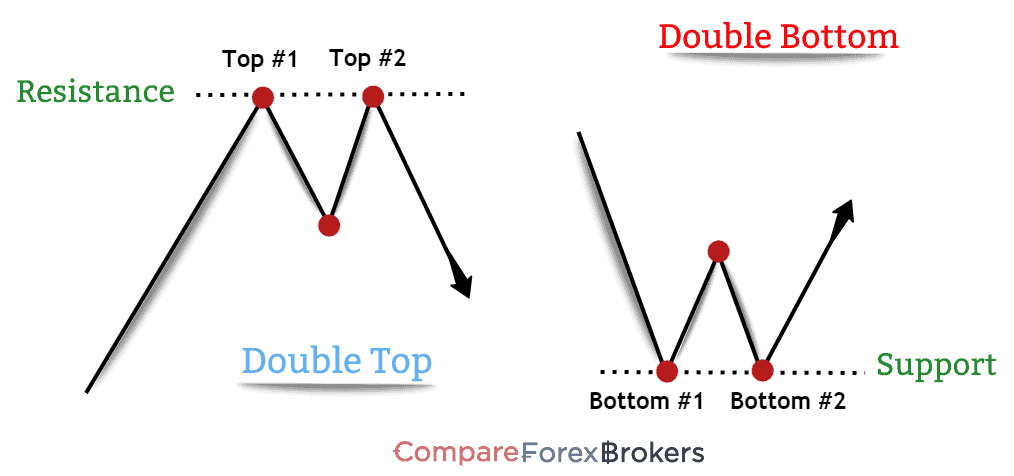
- Double Bottom: Two troughs at the same support after a downtrend. Break above resistance confirms bullish reversal.
- Example: USD/JPY double top at 110.00, breaking 108.50. AUD/USD double bottom at 0.7000, breaking 0.7200. Always look for stronger volume on the second peak/trough, increases reliability.
- Candlestick bars that add confirmation: Similar to the inverse head and shoulders, look for doji bars or bottoming tail bars that form the support. If the second bottom is slightly higher than the first, you have a higher low, which is further confirmation and vice versa.
- Trade invalidation signs: An evening star followed by an inverted hammer candlestick pattern after a double bottom, or a bullish engulfing pattern breaking above the second top on a double top.
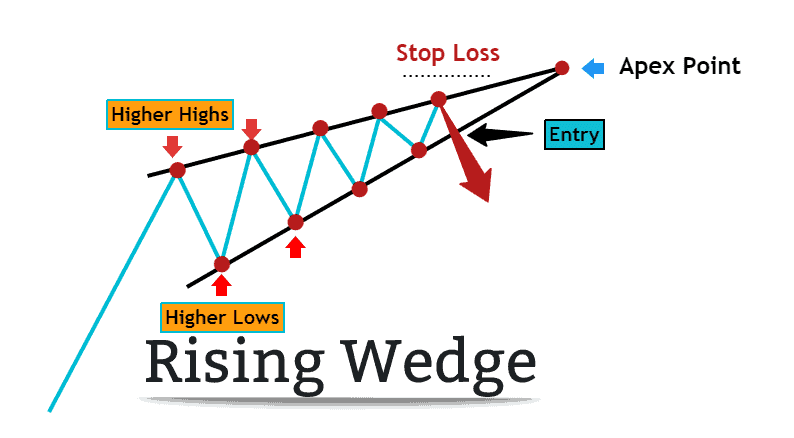
4. Rising and Falling Wedges (Reversal)
The Rising Wedge is a pattern converging upward toward trendlines in an uptrend. If you see a break downward, it’s likely a sign of a bearish reversal.
- How to trade: Enter long/short on breakout. Stop-loss just below the triangle high.
- Example: EUR/GBP trends are higher, forming falling wedge breaks above 0.8600, but they break down after a failed breakout. Try to measure the wedge’s height for target estimation so that you have a realistic take profit/stop loss setup.
- Candlestick bars that add confirmation: Look for wide body bars that break through the wedge and drill to lower timeframes to find an entry. Look for any topping tail bars after a slight pullback.
- Trend invalidation signs: Consecutive bullish candles or resting bars near the apex or bullish engulfing candlestick bars making significant higher highs means you have to wait before an entry.
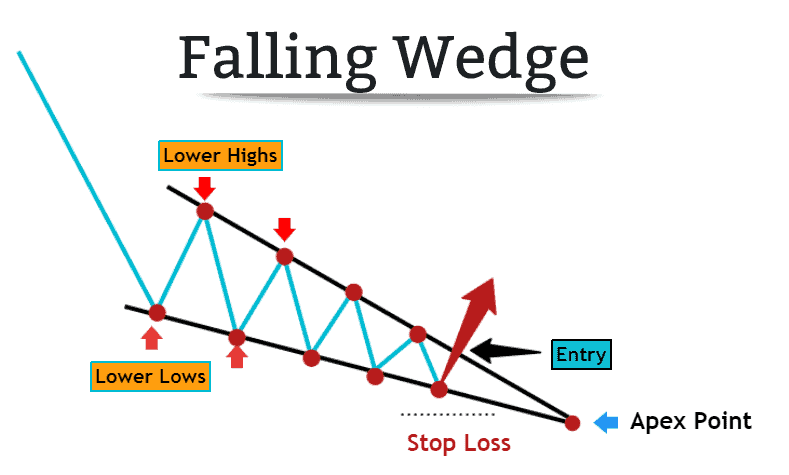
5. Falling Wedge Pattern
The falling wedge is a price formation that can be identified by a series of lower lows followed by successive lower highs where the length of each subsequent price movement between the low and the high becomes smaller and smaller.
- How to trade: Spot converging trendlines connecting lower highs and lower lows (e.g., EUR/USD sliding from 1.1200 to 1.1000, with each rally getting weaker).
- Example: Target the wedge’s height added to the breakout point. If the wedge spans 150 pips (1.1200–1.1050), aim for 1.1200 (breakout at 1.1050 + 150 pips).
- Candlestick bars that add confirmation: Look for a wide or standard sized body candle to break through the wedge. Further confirmation occurs if a red doji candle retests the wedge and bounces back up.
- Trend invalidation signs: An inverted hammer candlestick pattern with a wick that stops near or at the first lower high of the wedge usually means price is likely going much lower.
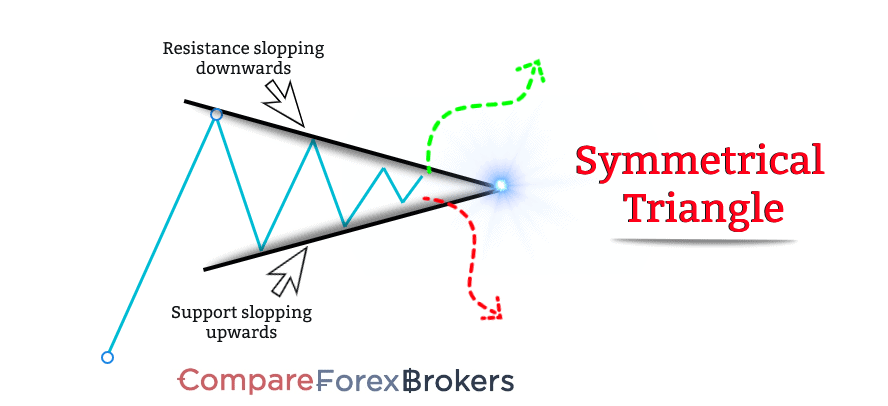
6. Symmetrical Triangle (Continuation)
This pattern happens when you have converging trendlines showing consolidation. Breakout typically continues the prior trend.
- How to Trade: Enter long/short on breakout. Stop-loss inside the triangle.
- Example: USD/CAD consolidates in a triangle during an uptrend, breaking upward at 1.2500.
- Candlestick bars that add confirmation: Wait for 2-3 green or red candles to close to confirm the trend of a breakdown or breakthrough. A wide body candle breaking sloping resistance or support is a very strong indicator.
- Trend invalidation signs: Regular or inverted hammer bars that touch the supply or demand zones make the symmetrical triangle less prominent as an indicator.
False breakouts are common here, so always wait for closing confirmation on a higher timeframe.
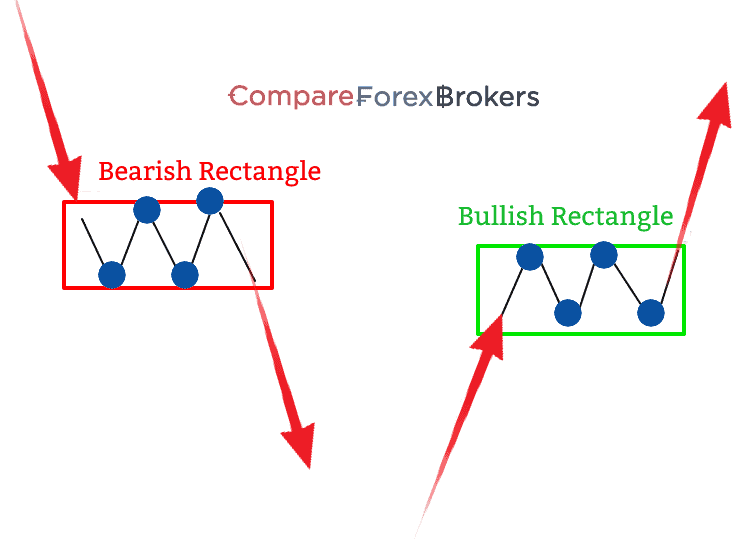
7. Rectangle Patterns
Price oscillates between horizontal support/resistance. A breakout typically follows the trend.
- How to Trade: Buy/sell on breakout. Stop-loss inside the rectangle.
- Example: GBP/JPY breaks out of a 150.00–152.00 range during an uptrend. Remember to trade in the direction of the broader trend for higher success.
- Candlestick bars that add confirmation: Look for a few narrow range bars followed by a wide body bar before jumping to a trade to avoid false breakouts. If you want further confirmation, wait for the first pullpack after a breakdown or reversal.
- Trend invalidation signs: Beware of a morning star patterns or dragonfly doji in a bearish triangle and an evening star or inverted hammer candlestick pattern in a bullish triangle.
How to Read Forex Charts for Beginners
Candlestick charts are foundational to understanding market sentiment and price movement. Here’s a breakdown of their anatomy:
My Expert Tips on Reading Candles For Trading
Always remember that a candle’s meaning depends on its location (e.g., at support/resistance, after a trend). As a trader, your goal is to get as many confirmations on your side as possible before going into a trade and risking your hard-earned money.
- A bottoming tail that forms a double-bottom retest is a much greater indicator for a possible bullish reversal, but even more so if under significant volume and at a prior support level. You get the point.
Never enter trades on the basis of a single candle, always use prior candles as they tell you a story. If the forex pair has gone up only for 6 weeks in a row, it’s probably smarter to look for short entries as opposed to long.
 .
.
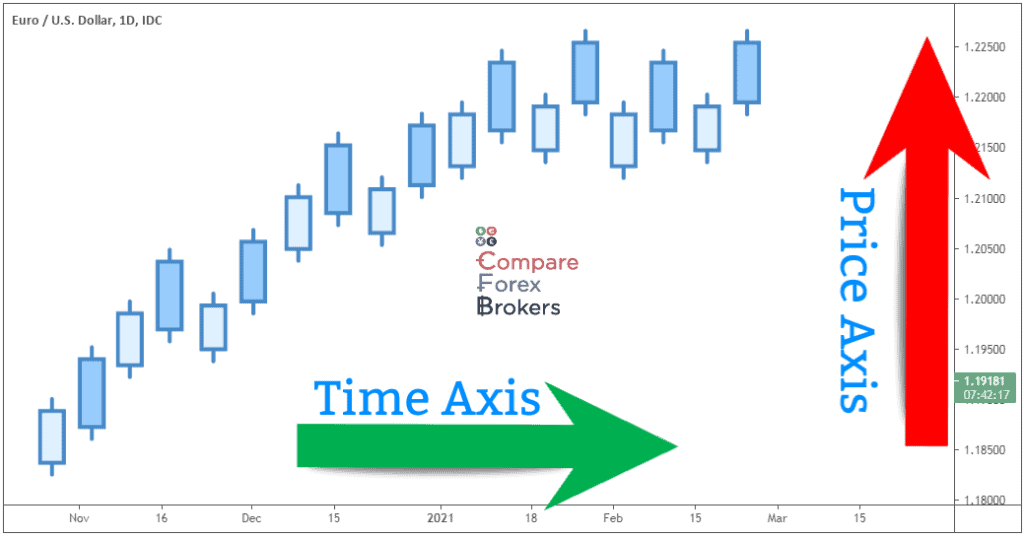
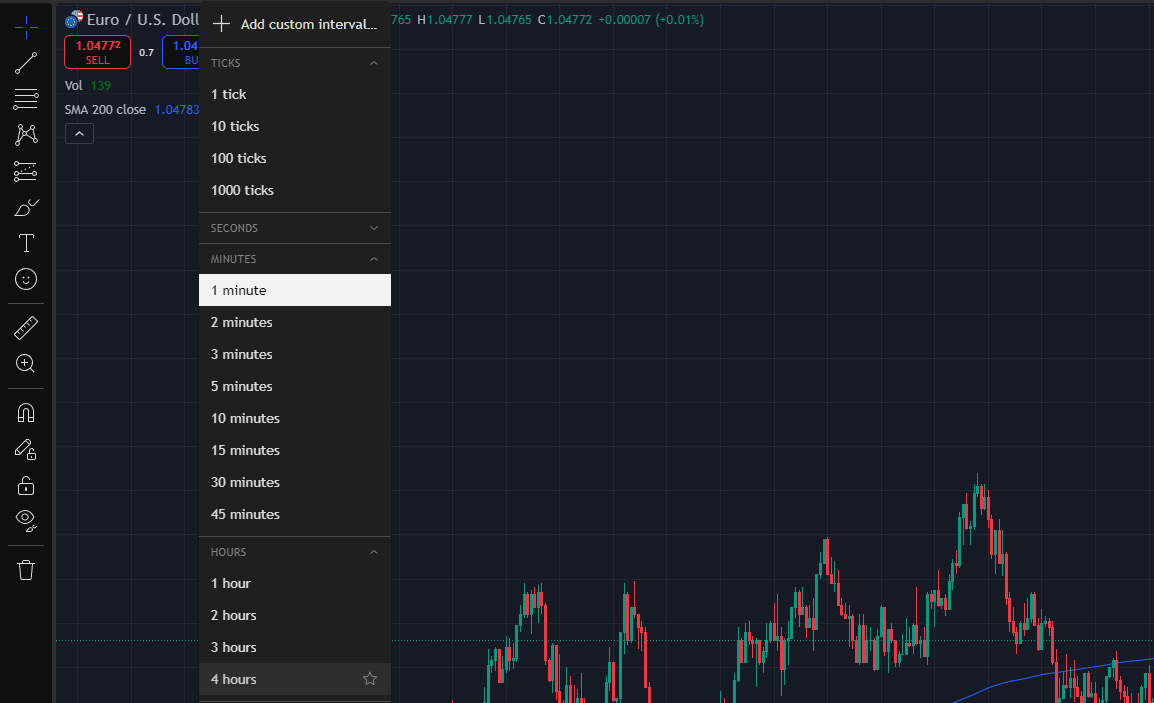
Timeframes: Which One Should You Use?
A timeframe is the setting on a chart you pick that represents the price action for a given unit of time. For example, if you select a 4-hour time frame, every candle stick will represent exactly 4 hours of price action.
Scalping Timeframes (1M – 15M Charts)
Forex patterns repeat on every single timeframe. Scalping is a high-frequency trading strategy focused on capturing small price movements over very short timeframes—typically 1-minute (1M) to 15-minute (15M) charts.
As a trader you can aim to enter and exit positions rapidly, often holding trades for a few minutes.
Here is what to pay attention to when scalping:
- Be aware that high trade frequency amplifies spread/commission costs—opt for brokers with tight spreads.
- Scalping is great if you are a more jumpy trader and can’t trade on higher timeframes, as you will know very quickly if your trade hits TP or SL.
- Use higher timeframes to confirm your trend bias, don’t get lost in the noise!
Long Term Trading, Day, Weekly, Monthly Swing Trading
Long-term trading capitalises on macroeconomic trends, fundamental shifts (e.g., interest rates, GDP growth), or multi-year technical patterns. Traders like Warren Buffett are patient and look at trades at very large timescales, sometimes even decades.
An example of a large timeframe forex trader would be holding EUR/USD for 6+ months based on diverging ECB/Fed rate policies.
This type of trading also comes with its own challenges, such as slow feedback loops (takes months to validate a thesis) and requires tremendous tolerance for large drawdowns.
Lower leverage is also advisable here, and you would apply the same principles from TA just as if you were scalping.
Spotting Support and Resistance Levels
Support and resistance (S&R) levels are foundational to technical analysis, acting as psychological and technical barriers where price tends to pause, reverse, or accelerate.
As you already know, past price action can help traders predict future price movements. With support and resistance levels, I try to find points in the chart where buyers or sellers repeatedly stepped in at least once or twice.
Here’s how to identify them effectively across timeframes:
- A price level where buying interest outweighs selling pressure, preventing further decline (e.g., a “floor”).
- A price level where selling pressure overcomes buying interest, halting upward momentum (e.g., a “ceiling”).
- Round numbers make for great psychological levels due to human reasoning.
- Look for areas where prices are repeatedly consolidated sideways.
- For longs, look for double-bottom or triple-bottom retests on a higher timeframe – which tells you where buyers or sellers usually stepped up and vice versa.
It’s important to remember that after a breakout, a broken resistance often becomes support after a retest (the floor becomes the ceiling).
Step-by-Step Guide to Trading Forex Patterns
Forex pattern trading blends technical precision with disciplined execution. I will show you some of the key fundamentals, from identifying high-probability setups, confirming them with volume and momentum, and managing risk to turn chart formations like flags, wedges, and triangles into actionable trades.
Step 1: Confirm Patterns with Volume and Momentum
When I trade forex patterns, the first thing I do is confirm their validity using volume and momentum. In forex, volume isn’t as straightforward as in stocks, so I rely on tick volume—counting price changes—to gauge activity. If a breakout from a pattern like a triangle or head and shoulders happens with a spike in tick volume, I trust it more.
Momentum tools like the RSI or MACD are my go-to for alignment. For example, if I spot a double bottom forming, I’ll wait for the RSI to show bullish divergence or the MACD to cross upward before jumping in.

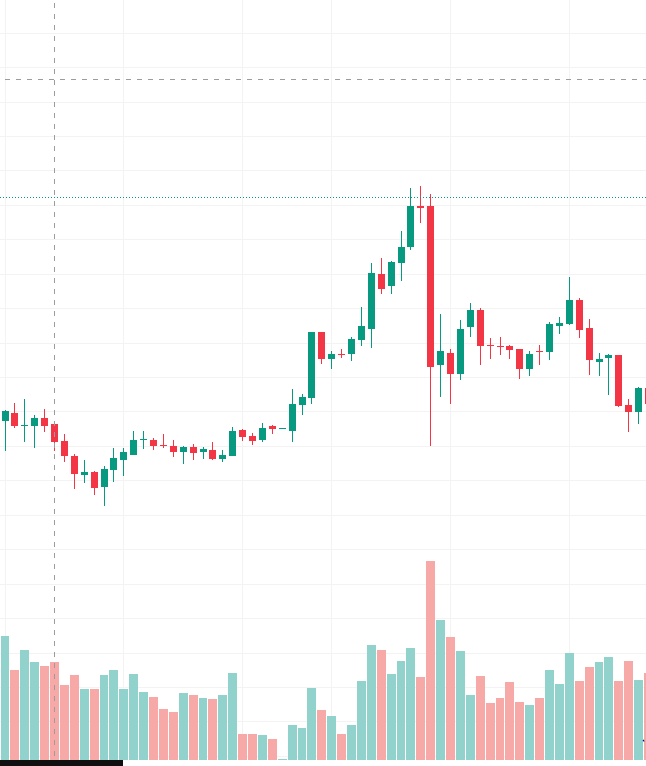
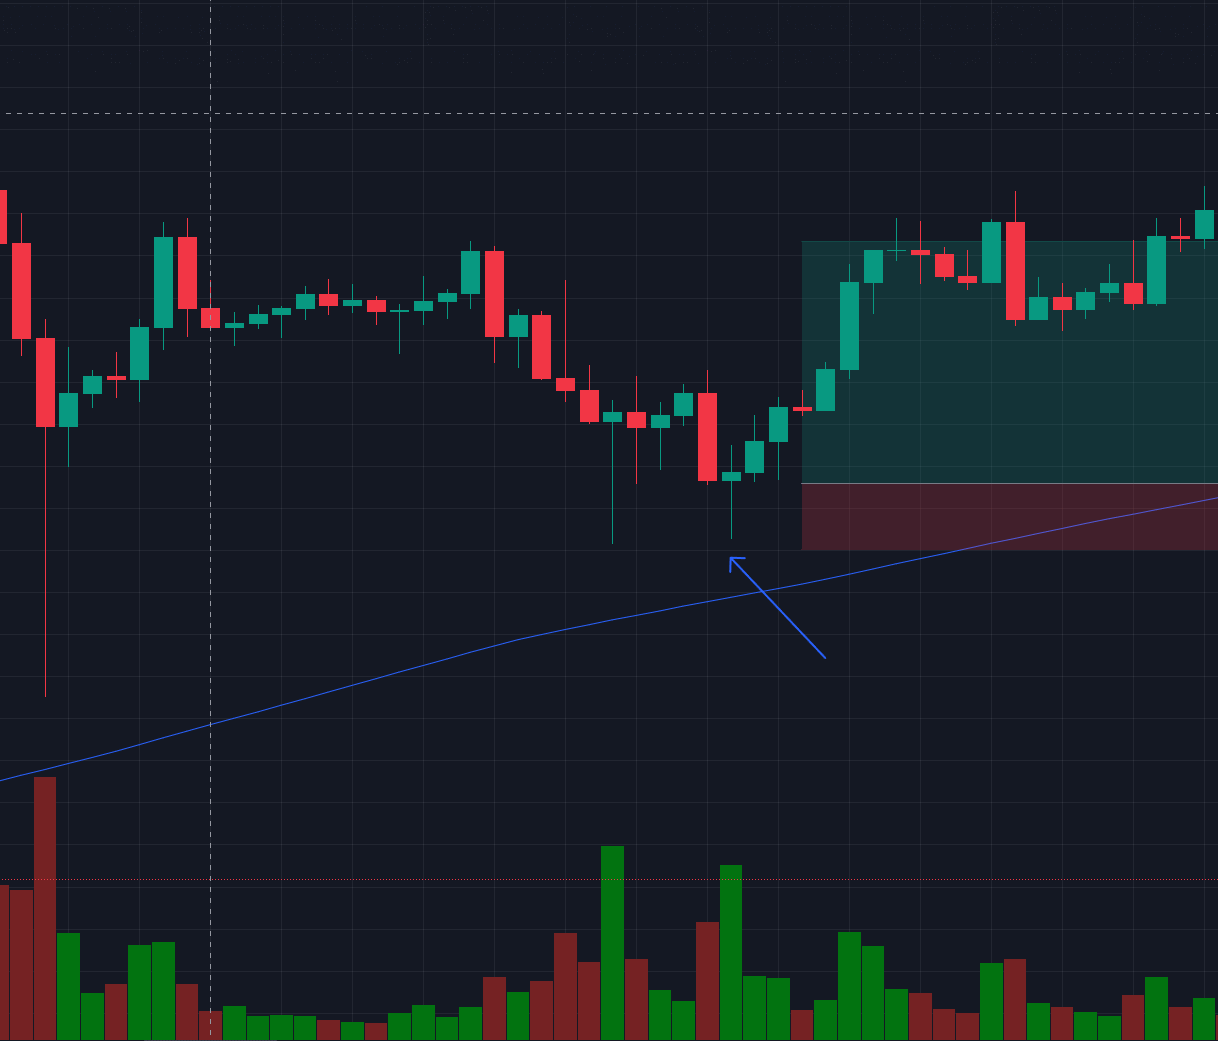
In the chart above, you can see strong buyer sentiment coming after a bearish downtrend. Notice how the two green doji candles and the tremendous volume they pulled. This occurrence strongly indicates buyers are stepping in, and a bullish reversal is likely.
Notice that these green candles were once red, but after a tug of war with sellers, they ended up closing higher.
These indicators act as a second opinion, telling me whether the pattern has real energy behind it. I will share my opinion on the use of indicators later.
Step 2: Get Confirmation on a Higher Timeframe
Timeframes are everything in my strategy. I’ve learned not to get lost in the noise of short-term charts. Instead, for scalp trades I start with the 4-hour chart to see the bigger trend—before zooming into the 15-minute or 5-minute charts to time my entries.
- If the 4-hour trend is bullish, I’ll only scalp buy setups on lower timeframes. This strategy keeps me aligned with the market’s rhythm and avoids costly counter-trend mistakes.
You can always use the smaller timeframes for scalping, such as the one hour or half hour, but it takes experience and practice to avoid false breakouts.
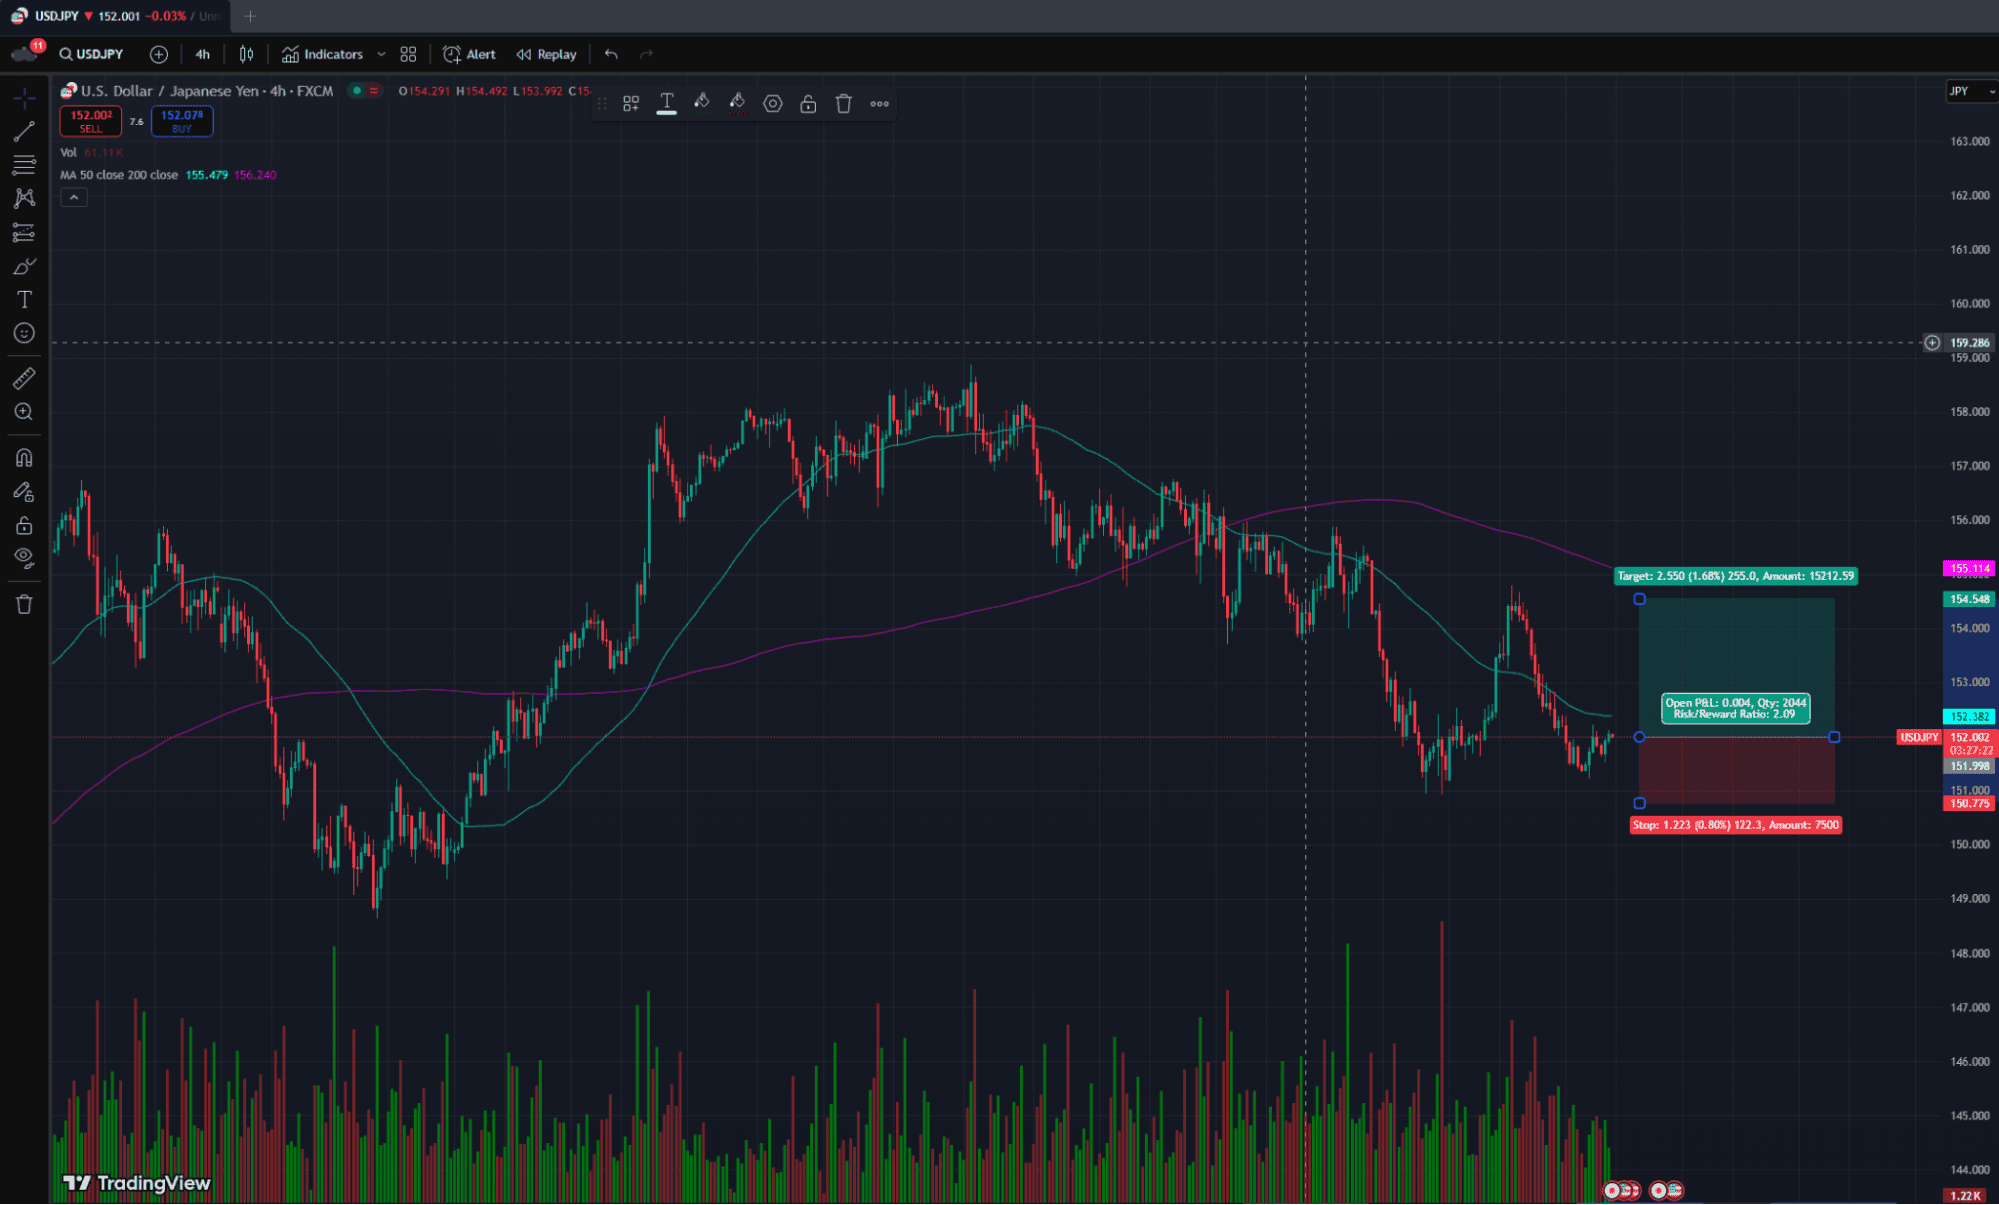
Step 3: Have Proper Risk Management When Trading Forex
Setting entry and exit levels is where discipline matters most. I enter trades only after a breakout closes beyond the pattern’s boundary, like the neckline of a head and shoulders. My stop-loss goes just beyond the pattern’s structure—say, below the swing low of a bullish flag—to give the trade room to breathe.
For take-profit, I aim for the pattern’s measured move. A flag’s profit target, for instance, is often the height of its flagpole. I always target at least a 1:2 risk-reward ratio, and if momentum is strong, I’ll trail my stop to capture 3R or more.
Do Trading Indicators Actually Work For Forex?
Do indicators work? Absolutely, but only if you use them as part of the story, not the whole script. I combine MACD crossovers or RSI divergences with price action.
For example, I’ll ignore a bullish MACD signal on the 1-hour chart if the daily trend is bearish. Higher timeframes rule my bias—they’re the backbone of every trade I take.
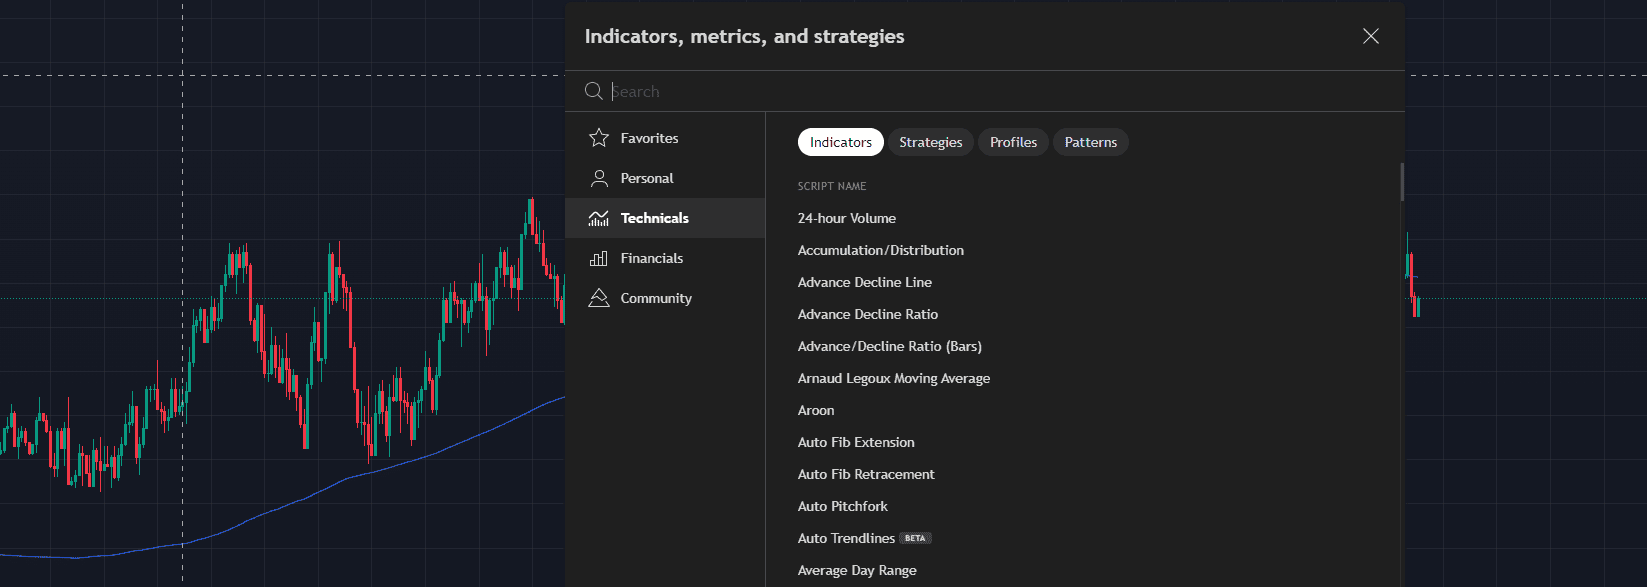
Use indicators as further confirmation, but don’t fully rely on them. There is not one single magical indicator that will give you an edge on the market, as if there was, everyone would use it, and then it wouldn’t work.
Common Mistakes When Trading Forex Patterns
When I first started trading patterns, I thought recognising a head and shoulders or a double top was enough to guarantee profits. But over the years, I’ve learned that even the cleanest-looking setups can fail spectacularly if you don’t avoid these three traps.
1. Overlooking Market Context (Trends, News)
Early in my career, I’d spot a textbook bullish flag on the 15-minute chart and dive in, only to get crushed because I ignored the fact that the daily trend was bearish. I’ve since drilled this into my routine: always check the higher timeframe trend first. If the 4-hour chart is screaming “downtrend,” no amount of lower timeframe bullish patterns will save you.
News events are another silent killer. I once held a perfect ascending triangle through a non-farm payroll (NFP) release—it collapsed in seconds. Now, I clear my trades before high-impact news or avoid trading altogether during these windows. Context isn’t just king; it’s the entire kingdom.
2. Ignoring Failed Patterns and False Signals
Pride is expensive in trading. I’ve held onto trades way past their expiration date because I refused to admit the pattern failed. For example, I’d watch a breakout retrace into the pattern’s body, leaving a long wick, but cling to hope instead of cutting losses.
Now, I set strict invalidation rules. If price closes back inside the pattern after a breakout, I’m out—no debates. Failed patterns often reverse violently, and staying in them can turn a small loss into a margin call.
If you are a beginner trader, however, it’s best to stay in your trades, as overthinking can hamper your learning curve.
3. Overtrading
In my early days, I’d trade every flag, wedge, or triangle I saw, even if they formed during choppy, sideways markets. This “FOMO” habit bled my account dry. I’ve learned that patience separates pros from gamblers.
If volatility is low, if the pattern’s boundaries are messy, or if momentum indicators are flat, I walk away. Waiting for A+ setups—those aligned with the trend, confirmed by volume, and timed around key support/resistance—saves mental capital and keeps my win rate intact.
Conclusion
Trading forex patterns has taught me that success isn’t about predicting the future—it’s about stacking probabilities and managing risk with military precision. Over the years, I’ve seen traders (myself included) fall in love with the “art” of patterns while ignoring the science of context, discipline, and adaptability.
The truth is, even the most beautiful chart formations are useless if you’re fighting the trend, ignoring news catalysts, or risking too much on low-conviction setups. The real edge lies in the mundane details: aligning your trades with higher timeframe trends, cutting losses the moment a pattern fails, and waiting for those rare A+ setups where everything aligns—price action, momentum, volume, and market sentiment.
Pattern trading in Forex is, at the end of the day, a battle of the mind. It’s silencing the noise, trusting your system, and remembering that losses are just the price of doing business. Study the charts, backtest ruthlessly, and fine-tune your rules—but always remember that the market is under no obligation to do anything for you. Be disciplined, be humble, and let the patterns serve you, not control you.
Risk Disclaimer: Forex trading carries a high level of risk due to the use of leverage and may not be suitable for all forex traders. In this regard, it’s recommended to start trading first on a demo account until you master the art of reading forex price charts. Nowadays, most Forex Brokers In Australia offer risk-free demo accounts that you can try to hone up your trading skills.


Ask an Expert