If you’re researching the market or new to forex trading, the below statistics are designed to give you an overview of the size, turnover, and regulation.
Top 5 Forex Facts

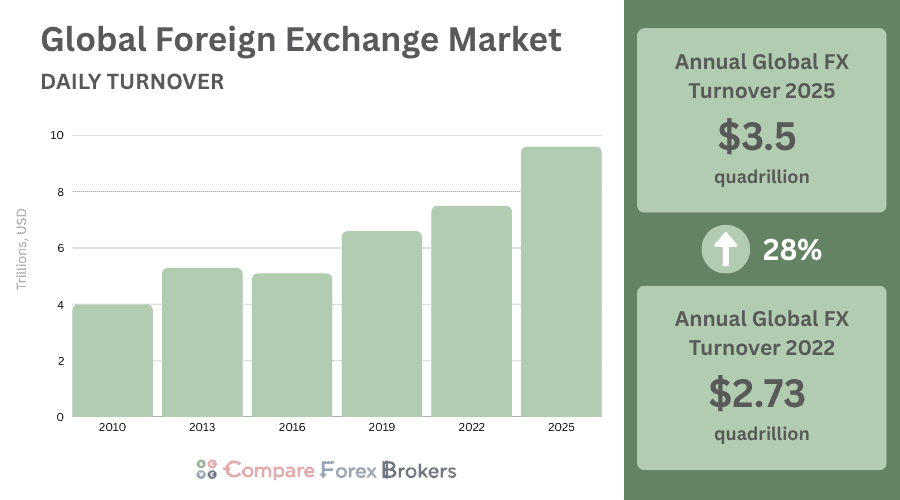
- The total value of the forex industry is $3.5 quadrillion, increasing from $2.73 quadrillion in 2022.
- Daily global forex trading volume was $9.6 trillion dollars in April 2025, increasing 28% from $7.5 trillion in 2022.
- Forex is the only financial market in the world to operate 24 hours a day and comprises over 170 different currencies.
- Seven currency pairs make up 66.3% of forex markets trading volume, a decrease from 85% in 2022.
- Oceania is the region with the lowest number of traders, but the highest number of traders per capita.
1. Foreign Exchange Market Turnover
How Much is the Forex Market Worth?
BIS’s 2025 Triennial Survey shows the average daily foreign exchange turnover globally rose from $7.5 trillion in 2022 to $9.6 trillion in April 2025, increasing by a significant 28%. This is a much larger jump than the previous period, where fx turnover increased 14% in the three years from 2019 to 2022.
Between 2022 and 2025, forex turnover grew twice as fast as the previous three year period, increasing by 28% compared to 14% from 2019 to 2022
When the 28% increase is annualised, it translates to $3.5 quadrillion traded on foreign exchange markets per year, up from $2.73 quadrillion in 2022. This means forex markets have retained their place as the largest financial market worldwide.
Foreign exchange is the largest financial market in the world in terms of trading volume, liquidity, and value.
The make up of the foreign exchange market has seen a shift since 2022, with data showing a move towards more immediate transactions compared to three years ago. Spot trading rose from $2.1 trillion to $2.96 trillion per day, increasing its share of the market from 28% to 31%, while swaps remained the largest at 41%
Foreign Exchange Turnover by Product from 2022 – 2025
| Product | 2022 | 2025 | Change from 2022 to 2025 (%) | Market Share 2025 (%) |
|---|---|---|---|---|
| Spot | $2.1 trillion | $2.96 trillion | +41% | 31% |
| Swaps | $3.8 trillion | $3.99 trillion | +5% | 41% |
| Forwards | $1.1 trillion | $1.85 trillion | +68% | 19% |
| Options and Other Products | $304 billion | $634 billion | +109% | 7% |
| Currency Swaps | $123 billion | $172 billion | +40% | 2% |
Forex Trader Demographics
Who Trades Forex?
In 2025, only 2.5% of forex trading is conducted by retail traders, with most transactions taking place between banks and other financial institutions. 46% of daily turnover is from reporting dealers which is unchanged from 2022.
Other financial institutions include smaller banks, hedge funds, pension funds, insurers, and asset managers, and their share has increased from 47% in 2022 to 50% in 2025, showing the stronger activity in spot and forwards.
Retail trading accounts for only 2.5% of the total foreign exchange market worldwide.
In 2022, retail driven activity made up around 6% of daily turnover, due to the greater demand for online trading during pandemic lockdowns, but has now dropped to from $450 billion to $242 billion over the past three years.
How Many Forex Traders Are There?
There are approximately 9.6 million forex traders in the world today.
Where is Forex Trading Most Popular?
The largest number of forex traders is in Asia, with around 3.2 million traders, however relative to its population, it’s the lowest per capita, with just 674 traders per million people.
By contrast, Oceania has the smallest number of traders in absolute terms at just 190,000, but the highest per capita rate, with more than 4,200 traders per million people. North America and the Middle East also have high per-capita participation, at 2,500 and 2,083 traders per million respectively.
Europe has around 1.5 million traders, similar to North America, but a lower participation rate at 2,000 per million. Africa now has about 1.3 million traders, a higher total than South America, yet only 878 traders per million given its much larger population.
These figures show that while Asia leads in total numbers, smaller regions like Oceania and North America have far greater trader penetration relative to population size.
Traders Per Region, Per Capita
| Region | Total No. of Traders | Traders per Million People |
|---|---|---|
| Asia | 3,200,000 | 674 |
| Europe | 1,500,000 | 2,000 |
| North America | 1,500,000 | 2,500 |
| Africa | 1,300,000 | 878 |
| Middle East | 1,000,000 | 2,083 |
| South America | 600,000 | 1,364 |
| Central America | 335,000 | 1,861 |
| Oceania | 190,000 | 4,222 |
Who Are Forex Traders?
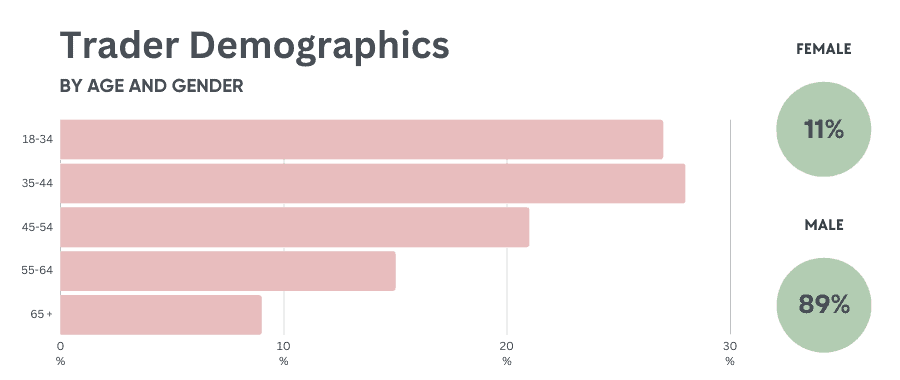
Men make up 89% of all forex traders worldwide, while only 11% of traders are women. A study by Warwick Business School found that women outperform men by 1.8%, due to their preference for long term strategies over short term risk.
In terms of age, forex traders are perhaps younger than you’d expect with 27% of forex traders falling into the 18 to 34 age group. The 35 to 44 age group makes up 28% of traders, while the 45 to 54 age group accounts for 21% of traders.
24% of traders are older than 55, and only 9% are older than 65.
2. Forex Currency Statistics
What Are The Seven Major Currency Pairs?
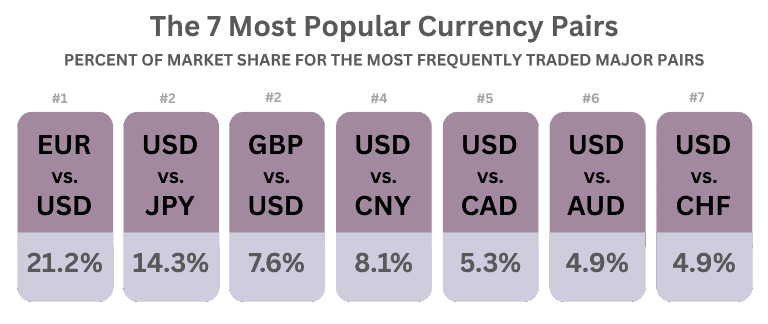
The seven major currency pairs are the EUR/USD, USD/JPY, GBP/USD, AUD/USD, USD/CHF, USD/CAD, and NZD/USD, these are also the most frequently traded currency pairs in the market.
Known as the “majors,” these pairs involve the world’s largest and most influential currencies. They are typically the most liquid, trade with the tightest spreads, and are often used as benchmarks for other foreign exchange pairs.
How Many Currencies Are There?
The global forex market comprises over 170 different major, minor, and exotic currencies.
What Are The Most Traded Currency Pairs?
The most commonly traded fx pair is the EUR/USD, accounting for 21.2% of global forex turnover. The second most traded currency pair is the USD/JPY, making up 14.3%. The third most traded currency pair is the GBP/USD, which accounts for 7.6% of turnover.
- EUR/USD: 21.2%
- USD/JPY: 14.3%
- GBP/USD: 7.6%
- USD/CNY: 8.1%
- USD/CAD: 5.3%
- USD/AUD: 4.9%
- USD/CHF: 4.9%
The seven major forex pairs account for 66.3% of forex transactions in 2025, down from 85% in 2022.
The decline isn’t from lower major-pair volumes, but from faster growth in other pairs. The standout change is USD/CNY, which rose to 8.1% of global turnover. USD/HKD also nearly doubled its share from 2.4% to 3.6%. As trading in these pairs and other emerging-market currencies has grown, the traditional euro, yen, and sterling pairs now make up a smaller share of total activity.
The majors remain central to the global forex market, but they’ve lost a significant 18.7% share to emerging and minor pairs in the past three years.
Major Currency Pairs Market Share
1. EUR/USD (Euro vs US Dollar)
EUR/USD remains the most traded pair, though its share dropped from 22.7% in 2022 to 21.2% in 2025. Volumes are still very high, but the pair now accounts for a smaller portion of overall turnover than in previous surveys.
2. USD/JPY (US Dollar vs Japanese Yen)
USD/JPY increased from 13.5% to 14.3% of global turnover between 2022 and 2025. It is the second most traded pair and continues to be the key Asian benchmark.
3. USD/GBP (US Dollar vs British Pound)
GBP/USD fell from 9.5% to 7.6%, the largest decline among the majors. While it remains one of the most liquid pairs, it has lost ground to faster-growing Asian currency pairs.
4. USD/CNY (US Dollar vs Chinese Yuan)
USD/CNY grew from 6.6% to 8.1%, the biggest gain of any major pair. It is now the fourth most traded pair, driven by the rising use of the renminbi in international trade and finance.
5. USD/CAD (US Dollar vs Canadian Dollar)
USD/CAD slipped from 5.5% to 5.3%. Trading levels remain steady but have not grown as quickly as in other major or emerging market pairs.
6. USD/AUD (US Dollar vs Australian Dollar)
USD/AUD edged down from 5.1% to 4.9%. It remains an important commodity linked pair but has seen its share gradually decline over recent surveys.
7. USD/CHF (US Dollar vs Swizz Franc)
USD/CHF rose from 3.9% in 2022 to 4.9% in 2025, the largest percentage increase among the majors. The franc continues to play its traditional role as a safe haven currency.
Forex Pair Market Share from 2010 – 2025
| Forex Pair | 2010 (%) | 2013 (%) | 2016 (%) | 2019 (%) | 2022 (%) | 2025 (%) |
|---|---|---|---|---|---|---|
| EUR/USD | 27.7 | 24.1 | 23.1 | 24.0 | 22.7 | 21.2 |
| USD/JPY | 14.3 | 18.3 | 17.8 | 13.2 | 13.5 | 14.3 |
| USD/GBP | 9.1 | 8.8 | 9.3 | 9.6 | 9.5 | 7.6 |
| USD/CNY | 0.8 | 2.1 | 3.8 | 4.1 | 6.6 | 8.1 |
| USD/CAD | 4.6 | 3.7 | 4.3 | 4.4 | 5.5 | 5.3 |
| USD/AUD | 6.3 | 6.8 | 5.2 | 5.4 | 5.1 | 4.9 |
| USD/CHF | 4.2 | 3.4 | 3.6 | 3.4 | 3.9 | 4.9 |
Significant Changes to Minor and Exotic Pairs
Minor forex pairs involve currencies less frequently traded than the majors, while exotic pairs match a major currency with one from an emerging or smaller economy.
These pairs are typically more volatile, with trading activity influenced greatly by domestic economic conditions such as inflation, capital flows, and political stability. The 2025 BIS survey shows that while some minor and exotic pairs are gaining traction, others have continued to lose ground.
USD/TRY (US Dollar vs Turkish Lira)
USD/TRY has continued to lose ground. In 2016 it made up 1.3% of global turnover, then it fell to 0.3% in 2022, and now has dropped even further to 0.2% in 2025. Trading volumes have thinned as Turkey’s currency remains highly volatile and confidence in the lira has weakened due to ongoing geo-political issues.
EUR/GBP (Euro vs British Pound)
EUR/GBP has been stable for more than a decade. It accounted for 2% of turnover in 2022 and now makes up 1.8% in 2025. Volumes remain steady, showing that despite sterling’s overall decline in the global market, the euro pound pair is still widely used.
USD/RUB (US Dollar vs Russian Ruble)
USD/RUB has almost disappeared from global trading. In 2019 it made up 1.1% of turnover, then fell to 0.3% in 2022, and is now just 0.1% in 2025. Sanctions and capital controls after Russia’s invasion of Ukraine have pushed most ruble trading onshore, leaving very little activity in international markets.
EUR/CNY (Euro vs Chinese Yuan)
Trading between the euro and Chinese yuan remains small but consistent. It held a 0.1% share in 2025, unchanged from 2022. Growth in renminbi trading has so far been concentrated in USD/CNY rather than in crosses with other major currencies like the euro.
JPY/AUD (Japanese Yen vs Australian Dollar)
JPY/AUD has slipped gradually over time. It fell from 0.6% in 2010 to 0.5% in 2022, and now stands at 0.4% in 2025. Volumes are stable, but its relative share has declined as other Asian and emerging market pairs have expanded more quickly.
USD/KRW (US Dollar vs South Korean Won)
Turnover grew from 1.4% in 2022 to 1.8% in 2025, with continued growth expected in the coming years. Korea’s status as a major exporter in electronics and semiconductors makes the won an increasingly active hedging instrument for global corporates.
USD/PLN (US Dollar vs Polish Zloty)
The Polish zloty showed stronger activity, rising from 0.9% in 2022 to 1.2% in 2025 . As one of the most liquid Central and Eastern European (CEE) currencies, PLN has benefited from regional energy market dynamics and EU-linked investment.
What Are the Most Popular Currencies?
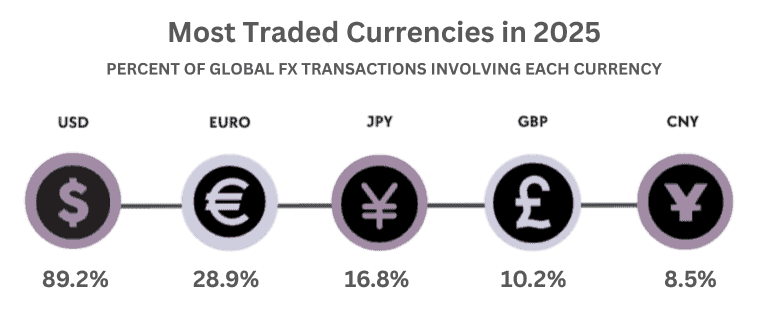
The most popular and influential currencies are the US Dollar (USD), Euro (EUR), Japanese Yen (JPY), British Pound (GBP), and Chinese Yuan (CNY).
While 38% of all forex transactions take place in the UK, 89.2% of global foreign exchange transactions involve the dollar.
From 2022 to 2025, the US dollar’s share increased, the euro and sterling lost ground, the yen held steady, and the yuan continued to rise. Together, these shifts show how Asia is continuing to take a larger role in global markets.
The British pound’s share of forex turnover fell to 10.2% in 2025, its lowest level ever recorded in the BIS Triennial Survey.
1. United States Dollar (USD)
The dollar was on one side of nearly nine out of ten global trades in 2025. Its share increased to 89.2% from 88.4% in 2022, showing that even as trading broadens into other pairs, the dollar’s role as the settlement and reserve currency has only grown stronger. No other currency comes close in terms of reach.
2. Euro (EUR)
The euro slipped again, dropping to 28.9% in 2025 from 30.6% in 2022. This continues a steady fall from 39% in 2010. The eurozone’s slower growth and limited integration in global trade compared to the US and Asia have weighed on the currency’s role in forex markets.
3. Japanese Yen (JPY)
The yen held steady at 16.8%, almost unchanged from 2022. It remains the leading Asian counterpart to the dollar but has not gained ground like the yuan. Japan’s unique monetary policy approach and relatively low yields keep the yen active for hedging but limit its growth in global share.
4. British Pound (GBP)
Sterling saw the largest drop among the majors, falling to 10.2% in 2025 from 12.9% in 2022. This is its lowest level in BIS survey history. The decline reflects London’s reduced dominance as a global hub and weaker reliance on sterling in cross-border trade since Brexit.
5. Chinese Yuan (CNY)
The yuan rose to 8.5% in 2025, up from 7.0% in 2022. Its steady climb shows how China’s growing weight in global trade and commodities has translated into more foreign exchange activity. Most of this remains concentrated in USD/CNY, but the yuan’s share is now larger than sterling’s was in 2010, marking a structural shift in the currency hierarchy.
Market Share by Currency 2010 – 2025
| Currency | 2010 (%) | 2013 (%) | 2016 (%) | 2019 (%) | 2022 (%) | 2025 (%) |
|---|---|---|---|---|---|---|
| USD | 84.9 | 87.0 | 87.6 | 88.3 | 88.4 | 89.2 |
| EUR | 39.0 | 33.4 | 31.4 | 32.3 | 30.5 | 28.9 |
| JPY | 19.0 | 23.0 | 21.6 | 16.8 | 16.7 | 16.8 |
| GBP | 12.9 | 11.8 | 12.8 | 12.8 | 12.9 | 10.2 |
| CNY | 0.9 | 2.2 | 4.0 | 4.3 | 7.0 | 8.5 |
3. Global Forex Trading Statistics
Which Countries Have the Most Forex Turnover?
In terms of global forex trading, the UK forex markets remain the largest trading centre, accounting for 38% of global turnover in 2025. US markets are 19%, while Singapore has strengthened its position, rising to 11.8%, up from 9% in 2022. Hong Kong’s share stayed steady at 7%, and Japan remains in fifth place at 4%.
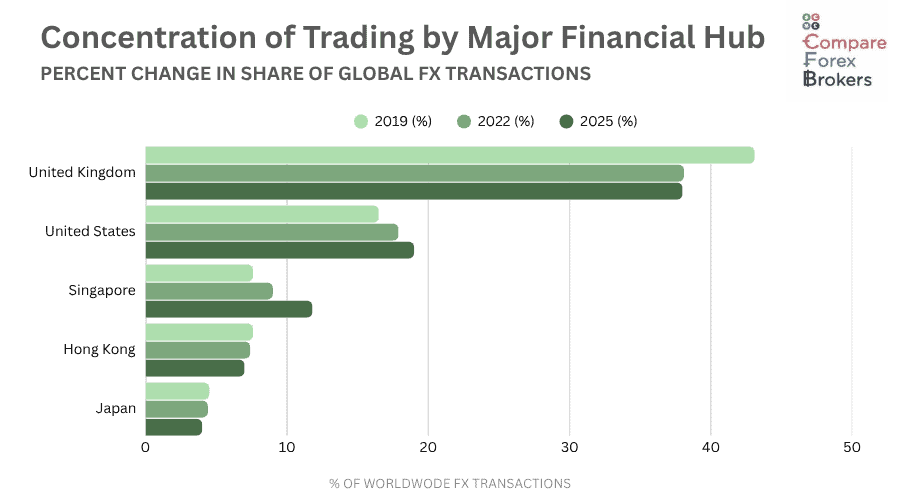
The five major financial hubs, being UK, US, Singapore, Hong Kong, and Japan, handle 79% of all global forex transactions.
- United Kingdom (38%): London continues to dominate the global forex market, with over a third of all transactions passing through its trading desks. Its time zone advantage, deep liquidity pools, and role as a hub for both European and global flows keep it firmly at the centre of forex trading.
- United States (19%): The US holds second place with just under a fifth of global turnover. The dollar’s role as the world’s reserve currency ensures New York remains one of the most active forex centres.
- Singapore (11.8%): Singapore has recorded the fastest growth among the top trading centres, with their share increasing 18.4% from 2019 to 2022, then 31.1% in the past three years. This steady climb reflects its growing role as Asia’s forex hub, supported by its position between China and Southeast Asia and by some investment shifting away from Hong Kong.
- Hong Kong (7%): Despite ongoing political and economic pressures, Hong Kong has held its market share steady since 2022. While some business has shifted to Singapore, Hong Kong remains a major gateway for Chinese capital flows.
- Japan (4%): Japan rounds out the top five, though its share has slipped compared to earlier surveys. The yen is still one of the most traded currencies globally, but Tokyo now plays a smaller role relative to Singapore and Hong Kong in intermediating regional flows.
Major Financial Hubs Forex Turnover from 2019 – 2025
| Region | 2019 (%) | 2022 (%) | Change 2019-2022 (%) | 2025 (%) | Change 2022-2025 (%) |
|---|---|---|---|---|---|
| UK | 43.1 | 38.1 | -11.6 | 38 | -0.3 |
| USA | 16.5 | 17.9 | +8.5 | 19 | +6.1 |
| Singapore | 7.6 | 9 | +18.4 | 11.8 | +31.1 |
| Hong Kong | 7.6 | 7.4 | -2.6 | 7 | -5.4 |
| Japan | 4.5 | 4.4 | -2.2 | 4 | -9.1 |
Australian Forex Trading Statistics
How Popular is Forex Trading in Australia?
According to the most recent edition of Investment Trends, Australia has the largest penetration of CFD/forex trading in the world on a per capita basis. In 2021, over 100,000 Australians executed one or more fx or CFD transactions. There are also the most forex brokers in Australia based on a per capita basis. More analysis including the BIS report focusing on the region can be viewed on our Australia Forex Market page.
After Australia, the next largest countries in terms of the number of active trades are Germany (84,000) and Poland (80,000). To put this in perspective, Australia’s population of 26 million is significantly lower than Germany (84 million) and Poland (38 million) but Australia still has more active traders.
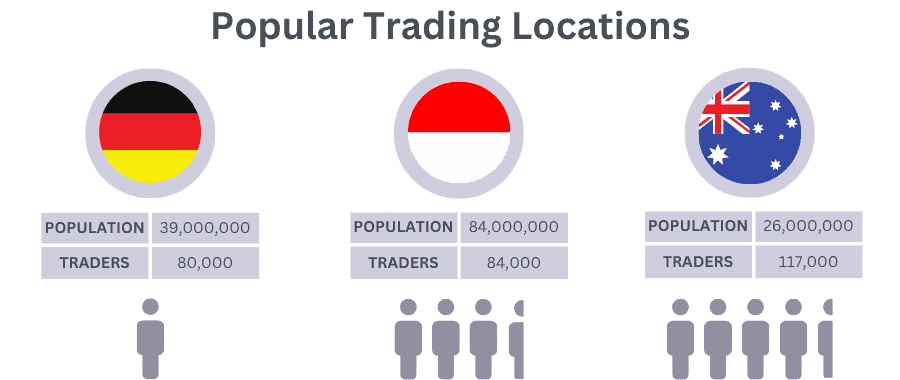
CFD/forex trading continues to gain popularity in Australia. In 2017, 61,00 Australians had a trading account that was active, in 2018 and 2019 this grew to between 75,000 and 79,000, respectively. Numbers continued to climb in the following years, reaching 117,000 in 2020.
What Is the Average Deposit in Australia?
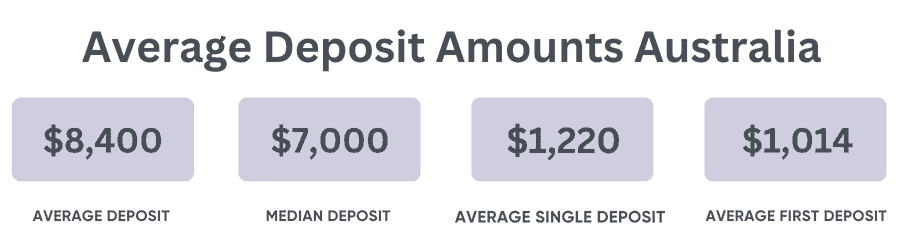
Between January and October 2021, the average deposit by Australian traders into their forex trading account was $8,400.
The average median for the same period was $7,000 while the average single deposit was $1,220. This deposit is similar to the average first deposit of $1,014 ($642 median), according to cPattern data.
If you are researching equities instead of forex, you can read our report on average stock market returns in Australia.
4. Forex Statistics – Brokers
What are the Largest Forex Brokers?
The largest online brokers by volume is Australian brokerage IC Markets with $22.68 billion in daily turnover. US based Forex.com gained popularity and is now the second largest broker, with XM in third.
IC Markets
Founded in Australia and regulated by ASIC (Australia), CySEC (Europe), and the FSA (offshore), IC Markets has carved a niche for itself as one of the largest forex brokers by volume. The forex broker operates on an ECN model and offers top trading technology and incredibly low spreads, making it a favourite among forex traders. With a daily turnover of $22.68 billion, it’s no surprise that our IC Markets Review found them to be one of the most popular brokers.
Forex.com
Established in 2001 and regulated by multiple financial bodies like the FCA (UK), CFTC (US), and CySEC, Forex.com has risen to prominence in the forex trading world. The broker operates on both a dealing desk and STP model, offering a range of platforms and tight spreads. Our Forex.com Review rated the broker highly for their no-commission trading account.
XM
Established in 2009 and regulated by ASIC, CySEC, and the FCA, XM is a no dealing desk broker that has gained traction in the forex trading community. The online broker is known for its no requotes policy and fast execution speeds. You can view the 2025 XM Review.
5. The History of Forex Markets
Forex History Statistics
The forex market has transformed significantly over centuries, evolving from traditional currency exchange to a sophisticated, tech driven global trading environment. Here are some key statistics that illustrate foreign exchange markets evolution:
- People have been trading fx for hundreds of years. The first forex market in history was established in Amsterdam nearly 500 years ago.
- Forex trading popularity saw a rise in popularity in the early 20th century, between 1903 to 1913 the number of trading firms in London increased from 3 to 71.
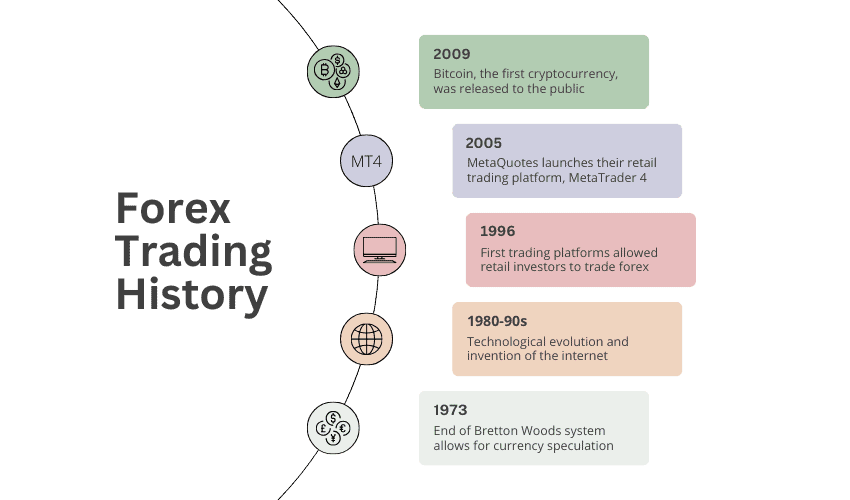
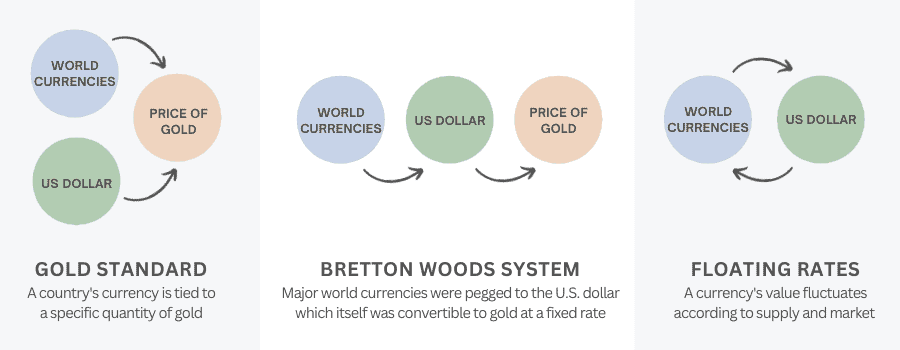
- Prior to 1973 speculating on currency movements was not possible due to central banks monetary policy (the gold standard and Bretton Woods agreement). When the Bretton Woods system collapsed in 1973, floating exchange rates were introduced, enabling speculative trading.
- A key change that aided retail forex trading was the technological wave in the 1980s-1990s and the invention of the internet.
- From 1996, retail forex traders were able to enter the market with the first trading platforms released and the market became even more accessible in 2005 when MetaQuotes released MetaTrader 4 (MT4).
How Did Retail Forex Trading Start?
The Gold Standard and the Bretton Woods system worked to control global monetary policy and currency valuation. As Central Banks tightly regulated exchange rates, traders could not speculate on foreign currency movements.
After the collapse of the Bretton Woods system in 1973, floating exchange rates opened the door for modern-day forex trading.
Prior to the 1970s, forex trading as we know it today did not exist.
History of Forex Trading Platforms

The first retail forex platforms appeared in 1996, opening the market to individual traders for the first time. A decade later, MetaQuotes transformed the industry with the release of MetaTrader 4 (MT4) in 2005. MT4 became the standard platform for retail forex trading, offering user friendly charting, technical indicators, and support for automated strategies through Expert Advisors.
MetaTrader 5 (MT5) was released in 2010, designed as a more advanced platform with more features, but adoption was slow. For many years, traders and brokers continued to prefer MT4 thanks to its established ecosystem of tools and community support.
That balance has finally shifted, and this year, MT5 overtook MT4 in global usage for the first time, becoming the most widely used retail trading platform. While MT4 remains active, especially with long standing traders, online brokers are increasingly prioritising MT5 for new accounts.
In 2025, for the first time ever, MT5 has taken over MT4 as the most popular trading platform worldwide.
History of Cryptocurrency
Since the release of Bitcoin in 2009, the first decentralised cryptocurrency, the market has grown to include more than 13,000 coins and tokens.
After reaching a peak of $2.9 trillion in 2021, the global cryptocurrency market fell sharply to $798 billion in 2022. By 2023 it had risen to $1.1 trillion, and in 2025 it is valued at around $2.54 trillion.
Although still below the 2021 high, the market has more than tripled in size between 2022 and 2025, showing how quickly capital has returned to digital assets after the downturn.
Crypto products are usually traded against the USD (US dollar), EUR (Euro), GBP (British pound sterling), or AUD (Australian dollar).
The global cryptocurrency market has grown from $798 billion in 2022 to $4 trillion in 2025, more than tripling in just three years.
For more information on cryptocurrency, read our full report on the real cost of mining Bitcoin.
6. Forex Market Hours and Trading Sessions
When are Forex Markets Open?
The continuous trading environment is made possible by the interplay of four global trading sessions, ensuring fx markets are open 24 hours a day during weekdays.
Forex is a 24 hour market, except for weekends and holidays.
What are the Four Forex Trading Sessions?
Trading sessions are divided into four major times: New York session (US, EST), London session (UK, GMT), Tokyo session (Japan, JST), and the Sydney session (Australia, AEST).
| Session Name and Location | Open Time (Local / UTC) | Close Time (Local / UTC) |
|---|---|---|
| Sydney Session - Australia (AEST) | 08:00 AEST / 22:00 UTC | 16:00 AEST / 06:00 UTC |
| Tokyo Session - Japan (JST) | 09:00 JST / 00:00 UTC | 18:00 JST / 09:00 UTC |
| London Session - UK (GMT) | 08:00 GMT / 08:00 UTC | 16:00 GMT / 16:00 UTC |
| New York Session - US (EST) | 08:00 EST / 13:00 UTC | 17:00 EST / 22:00 UTC |
You can learn more about the best forex trading hours for Australians using our Time Zone Converter.
History of the London Trading Session
The London Stock Exchange (LSE) was eventually formed in 1801. Today, London remains the world’s largest forex trading centre. Often considered the original forex trading session, London has been a major financial hub since the Middle Ages, and was the birthplace of the foreign exchange market in its current form.
History of the New York Trading Session
The New York session emerged as US markets grew in significance, with Wall Street being a financial hub since the late 18th century. In 1792, the New York Stock Exchange (NYSE) was established, making it the oldest stock exchange in the United States.
At present, New York is the second largest forex trading session, and considered the unofficial close of the forex trading day.
History of the Tokyo Trading Session
The Tokyo session gained prominence after World War II as Japan rebuilt its economy and become a major player in the global finance world. The Tokyo Stock Exchange (TSE) was first established in 1878, but was temporarily closed during the Second World War.
Tokyo is the financial hub for the Asian session, which is the third largest of the four key trading sessions.
History of the Sydney Trading Session
The Sydney session is by far the youngest, with the Australian Securities Exchange (ASX) only being founded in 1987, following a merger of six independent stock exchanges in Australia.
The Australian session is the smallest of the key trading trading sessions, but still a significant session in the Pacific region.
When is the Best Time to Trade Forex?
Due to high liquidity and volatility, the best time to trade forex is when the London and New York sessions overlap, between 1:00 pm and 4:00 pm BST. For Australian traders, the overlapping period where volatility is at its peak is between 10:00 pm and 1:00 am AEST.
The UK is the leader in terms of trading volume, which peaks during the London trading session.
The Asian session is more suitable for flat strategies, while quieter periods during the New York and London sessions are suitable for trading strategies that require stable price movement.
In terms of the best day to trade forex, Thursday and Friday are the most volatile weekdays.
The exception to this is short-term fluctuations following the release of key news (i.e. interest rate decisions, announcements regarding budget and trade deficits, elections, trade wars, global crises, and so on).
Forex Session Time Zone Converter Tool
The Forex Time Zone Converter above is a useful tool to learn more about the different forex trading sessions and opening hours worldwide. It shows the four primary trading sessions, being Sydney, New York, London, and Tokyo, each of which corresponds to a major financial hub, as well as the current average trading volume.
Forex Market Time Zone Converter
- 0
- 1
- 2
- 3
- 4
- 5
- 6
- 7
- 8
- 9
- 10
- 11
- 12
- 1
- 2
- 3
- 4
- 5
- 6
- 7
- 8
- 9
- 10
- 11
- 12
- 0
- 1
- 2
- 3
- 4
- 5
- 6
- 7
- 8
- 9
- 10
- 11
- 12
- 13
- 14
- 15
- 16
- 17
- 18
- 19
- 20
- 21
- 22
- 23
- 24

Sydney
(UTC +10)

Tokyo
(UTC +9)

London
(UTC +1)

New York
(UTC -4)
Trading Volume is usually
at this time of day.

By sliding the draggable clock, you can view how each trading session corresponds with the time zone you have selected, as well as the trading volume for that period.
7. Forex Technology Statistics
What is the Most Popular Trading Platform?
MetaTrader 4 (MT4) remains the most popular platform by the number of users according to data from the MetaQuotes website (the company behind the MetaTrader 4 and MetaTrader 5 platforms).
85% of traders use MetaTrader 4, making it the most popular platform worldwide, while MT5 is used by 6% and ranks second.
As of 2021, over 80% of online brokers globally offered MT4 to customers, and the trading platform had an estimated user base of over 8 million traders. MT5, on the other hand, can claim only 2 million traders and is offered by just 20% of brokers.
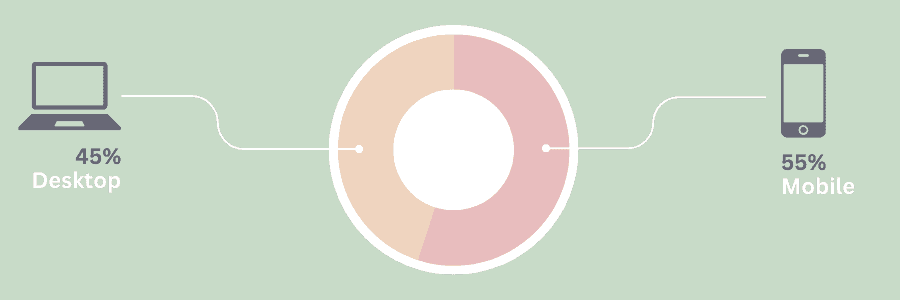
How do people trade?
55% of forex traders prefer to use a mobile device and trading app, versus 45% who use a desktop computer or web app.
8. Forex Trading Popularity By Country
In 2025 we have made a list of the most searched term for each country and the average search volume over 2025 to indicate the popularity of trading forex.
| Country | Search Term | Google Monthly Searches |
|---|---|---|
| India | Best Forex Broker India | 4,400 |
| Thailand | โบรกเกอร์ forex | 4,400 |
| Vietnam | sàn forex uy tín | 2,900 |
| UK | Forex Broker UK | 1,900 |
| South Africa | Best Forex Broker South Africa | 1,300 |
| USA | Forex Broker USA | 1,300 |
| UAE | Best UAE Forex Brokers | 1,300 |
| Australia | Forex Broker Australia | 1,000 |
| Mexico | mejores brokers en mexico | 720 |
| Malaysia | Forex Brokers Malaysia | 720 |
| Singapore | Forex Broker Singapore | 720 |
| New Zealand | Forex Broker New Zealand | 550 |
| Canada | Forex Broker Canada | 260 |
9. Forex Risk
As a retail investor, speculating on forex involves a very high risk of losing money due to high leverage and volatile fx markets. According to the financial body of the UK, the Financial Conduct Authority (FCA), about 80% of retail fx traders lose money.
Although 29% of retail investors achieve capital gains, 99% of forex traders fail to make profits for more than 4 continuous quarters.
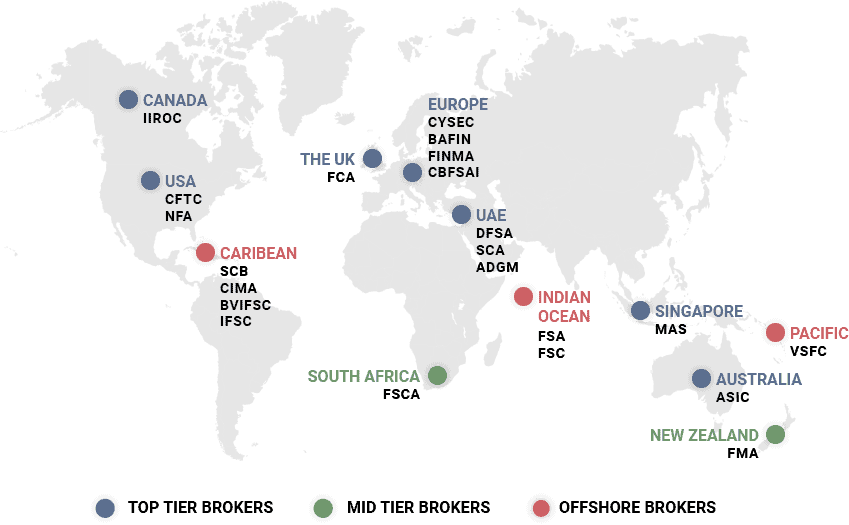
Who Regulates Forex Brokers?
Forex brokers are regulated by various financial authorities worldwide, each with distinct levels of oversight, ranging from stringent top-tier regulators to more lenient offshore bodies.
At CompareForexBrokers, we recommend trading exclusively through a fully licensed and regulated brokerage in your jurisdiction. There are different tiers of regulatory bodies depending on the framework enforced.
Top-tier Regulators
While top-tier financial regulators exist around the world and reflect national mores, all share several key characteristics: a strong legal framework and regulatory powers; stringent licensing and registration requirements for brokers; robust investor protection measures to prevent fraud; transparent dispute resolution procedures; and, regular audits and inspections.
Mid-tier Regulators
A mid-tier financial regulator may not offer the same regulatory powers and investor protection measures as a top-tier regulator, yet it still has a solid legal framework and enforces strict licensing and registration requirements for CFD brokers operating within its jurisdiction.
However, the quality and effectiveness of financial regulation can vary significantly between different mid-tier regulators, and forex traders should always conduct research before choosing a forex broker.
Offshore Regulators
Offshore regulators are generally less stringent than the stricter, top-tier regulators, yet the regulatory environments can vary significantly between different countries.
Some offshore regulators may have strong legal frameworks and robust investor protection measures in place, while others offer weaker regulations as well as licensing and registration requirements.
Disclaimer: Cryptocurrencies carry more risk than forex and other CFDs due to the historically high volatility of crypto markets. For this reason, all top forex brokers in the UK regulated by the FCA have been banned from trading cryptocurrencies for retail investors from 2020.
There is a high risk of losing money forex trading. For example, City Index (owned by GAIN Capital Holdings), warns 70% of CFD traders lose money trading forex. To reduce the risk of losing money when making forex trades, its recommended forex traders sign up to a regulated broker, practise forex trades on a demo account, make forex transactions with secure payment methods, and read all terms and conditions before trading.
Registering with a regulated broker will ensure you receive certain protections designed for retail forex traders, such as segregated client funds, leverage caps, and negative balance protection in some jurisdictions. These are designed to protect traders from losing significant amounts of money trading forex.
Note: Forex currency pairs, forex, foreign exchange, and fx are used interchangeably throughout this article.
Sources
- BIS Triennial Central Bank Survey 2025
- Warwick Business School
- Forex Trading Stats for Marketers
- BIS: Sizing up Global Foreign Exchange Markets
- Analysis: Australia Has the Largest FX/CFD Market Per Capita in the World (Finance Magnates)
Bank for International Settlements (BIS)
The majority of the forex trading statistics referenced in this article are sourced from the Bank of International Settlements (BIS) Triennial Central Bank Survey 2025. The survey conducted by BIS is the largest global analysis of financial markets, focusing on OTC derivatives and currency markets.


Ask an Expert