How We Test Forex Fees And Trading Costs [2026]
25% of our overall 2026 Forex Broker Score is devoted to Forex trading costs. Each month, we collate published data from brokers’ websites to compare trading costs across brokers. We also independently monitor Standard and RAW Account spreads over 24 hours to record and analyse actual average spreads.
Our broker reviews are reader supported and we may receive payment when you click on a partner site.
What Are Forex Trading Costs?
The trading cost is the amount the market must move before you make a profit. For example, if you go long (buy) 1 lot (100,000) with a trading cost of $10, your trade will need to increase by $10.00 before making any profit. The lower the trading cost, the more profit you can make.
Low trading costs are crucial to your success if your trading strategy relies on profits of just a few pips (e.g., scalping) or automated trading.
How We Analyse Standard Account Spreads
Standard Accounts charge no commission but have variable spreads (the difference between the bid and ask price). The spread is the only trading cost we need to account for this type of account.
We compare spreads for Standard Accounts in two ways:
- By comparing the average spreads published on brokers’ websites
- By independently monitoring spreads using our custom-built tool
Comparing Published Average Spreads
We collate data from brokers’ websites monthly. The table below shows the published spread data our team collated in February 2026. The most recent data can always be found on our Lowest Spread Forex Brokers page.
No Commission Spreads: Standard Accounts | |||||
|---|---|---|---|---|---|
| 1.00 | 1.00 | 1.27 | 1.30 | 1.20 | |
 | 0.83 | 0.84 | 1.14 | 1.51 | 0.96 |
 | 1.00 | 1.20 | 1.00 | 1.20 | 1.20 |
 | 0.80 | 1.20 | 1.20 | 1.50 | 1.20 |
 | 0.90 | 0.90 | 1.00 | 1.20 | 1.00 |
| 0.90 | 1.00 | 1.00 | 2.40 | 1.90 | |
| 1.20 | 2.00 | 1.90 | 2.40 | 2.30 | |
| 1.00 | 1.40 | 1.00 | 1.50 | 1.50 | |
| 1.00 | 1.11 | N/A | 1.30 | 1.28 | |
| 0.60 | 0.60 | 0.90 | 1.50 | 1.30 | |
| 1.10 | 1.10 | 1.10 | 1.20 | 1.20 | |
 | 0.60 | 0.70 | 0.90 | 1.00 | 0.80 |
 | 1.20 | 1.30 | 1.20 | 1.20 | 4.00 |
 | 1.24 | 1.44 | 1.38 | 1.88 | 1.68 |
 | 1.10 | 1.10 | 1.30 | 2.20 | 1.50 |
 | 1.00 | 1.00 | 1.50 | 2.00 | 1.50 |
| 0.80 | 0.90 | 1.20 | 1.80 | 1.80 | |
 | 0.50 | 0.60 | 0.70 | 1.20 | 1.30 |
 | 0.90 | 1.30 | 1.40 | 1.40 | 1.80 |
| 0.80 | 0.90 | 1.30 | 1.60 | 1.40 | |
 | 1.13 | 1.01 | 1.71 | 2.27 | 1.98 |
| 0.90 | 1.30 | 3.60 | 3.00 | 1.70 | |
| 1.00 | 1.20 | 1.60 | 2.10 | 1.80 | |
| 1.60 | 2.60 | 2.90 | 5.00 | 2.30 | |
| 1.10 | 1.20 | 1.50 | 1.70 | 1.40 | |
| 1.20 | 1.10 | 1.70 | 2.90 | 2.20 | |
 | 1.56 | 2.03 | 1.51 | 2.28 | 1.92 |
| 1.10 | 1.10 | 1.60 | 2.00 | 1.90 | |
 | 1.40 | 1.40 | 0.36 | 0.85 | 0.45 |
 | 1.50 | 1.50 | 1.70 | 1.60 | 1.60 |
 | 1.20 | 1.30 | 1.30 | 1.50 | 2.00 |
 | 0.70 | 0.80 | 1.30 | 2.40 | 1.30 |
 | 1.60 | 1.60 | 1.60 | 1.60 | 1.60 |
| 1.20 | 1.40 | 1.90 | 2.20 | 2.20 | |
| 1.40 | 1.40 | 1.70 | 1.80 | 2.20 | |
| 1.10 | 1.40 | 2.00 | 2.30 | 2.30 | |
 | 1.40 | 1.60 | 1.40 | 2.10 | 1.90 |
| 1.00 | 1.00 | 1.00 | 2.00 | 1.50 | |
| 0.80 | 1.00 | 1.50 | 2.80 | 2.00 | |
 | 1.70 | 1.60 | 1.70 | 2.50 | 2.70 |
| 1.30 | 1.70 | 1.20 | 1.50 | 1.90 | |
 | 1.40 | 2.50 | 2.50 | 2.60 | 2.60 |
| 1.20 | 1.80 | 1.90 | 2.30 | 2.30 |
 | 2.10 | 2.10 | 2.70 | 2.50 | 2.80 |
| 0.40 | 0.40 | 1.40 | 2.00 | 0.10 |
Avg. spreads are taken from each broker's website and updated monthly. Last update on 1 July 2026
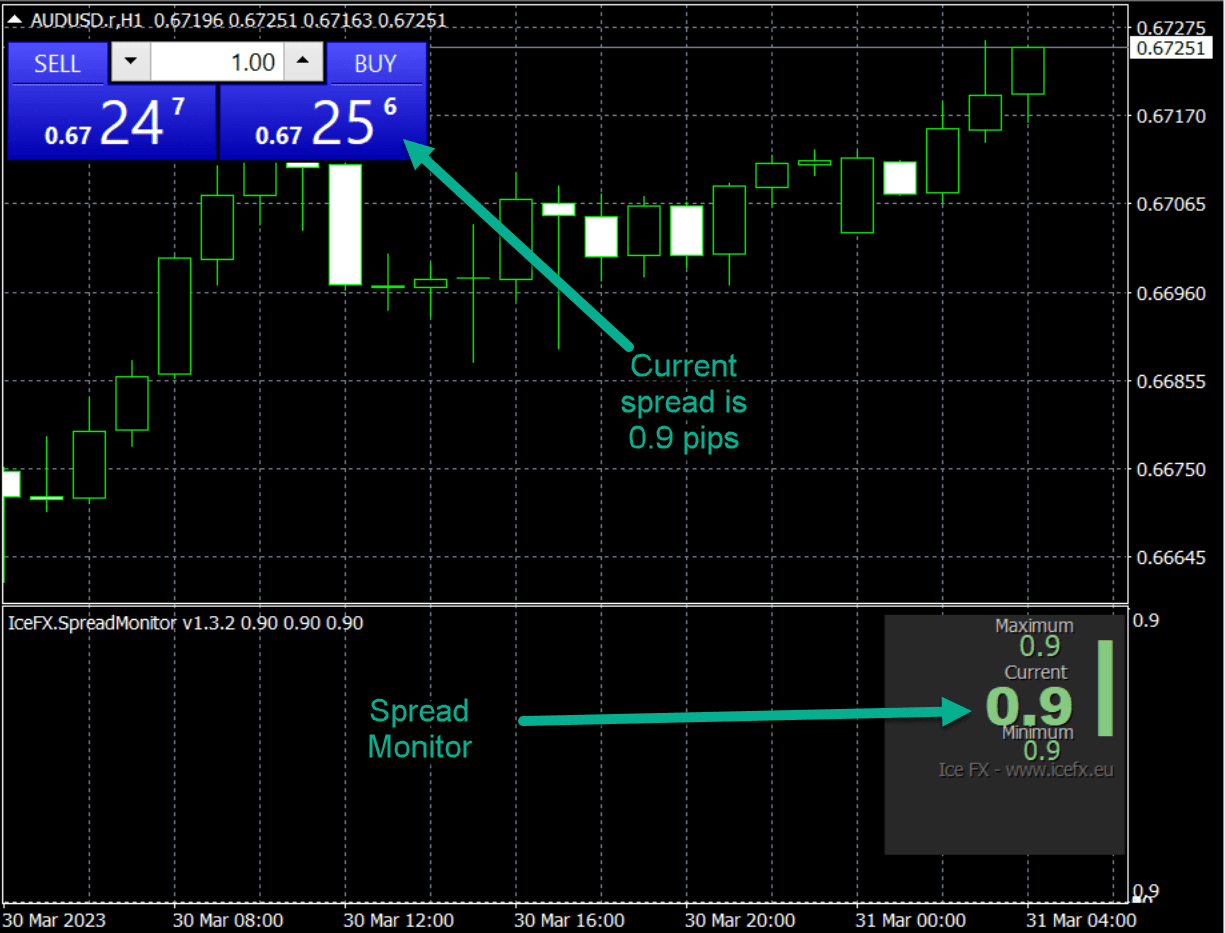
Testing Actual Standard Account Spreads
The six Major Forex Pairs – AUDUSD, EURUSD, GBPUSD, USDCAD, USDCHF and USDJPY are used to conduct our testing. The spread monitor’s screen output looks like this on an AUDUSD chart for H1 (hourly) data:
The indicator also writes the results to CSV files, providing us with data to perform our analysis. A typical CSV (for GBPUSD data at IC Markets) looks like this.
| Time | MaxSpread | AvgSpread | MinSpread |
|---|---|---|---|
| 2023.03.14 08:00 | 1.40 | 0.92 | 0.60 |
| 2023.03.14 09:00 | 1.40 | 1.09 | 0.60 |
| 2023.03.14 10:00 | 1.40 | 1.22 | 0.60 |
| 2023.03.14 11:00 | 1.40 | 1.08 | 0.60 |
How We Compare Raw Account Spreads
RAW Accounts charge a fixed commission and have variable spreads (generally lower than for Standard Accounts). RAW accounts at some brokers are also known as “Zero”, “Pro”, “Prime”, “Direct”, “FX-Active”, “Plus+”, “Razor”, and “Edge” accounts.
In Forex Trading, regardless of the name, these accounts follow a no-dealing desk model, meaning the broker is not your counterparty. Instead, they use electronic communication networks (ECN) or straight-through processing (STP) to connect traders to liquidity providers.
We compare spreads for Raw Accounts in two ways:
- By comparing the average spreads published on brokers’ websites
- By comparing the test results we get from running the spread monitor
Comparing Published Average Spreads
We collate data from brokers’ websites monthly. The most recent data is below (commissions “per side”).
ECN Forex Spread Comparison | |||||
|---|---|---|---|---|---|
| 0.00 | 0.30 | 0.10 | 0.10 | 0.20 |
| 0.14 | 0.58 | 0.49 | 0.28 | 0.34 |
| 0.10 | 0.50 | 0.30 | 0.30 | 0.10 |
| 0.10 | 0.20 | 0.20 | 0.20 | 0.10 |
| 0.90 | 0.18 | 0.14 | 0.14 | 0.13 |
 | 0.30 | 0.50 | 0.30 | 0.50 | 0.40 |
| 0.00 | 0.10 | 0.20 | 0.10 | 0.10 |
| 0.16 | 0.70 | 0.24 | 0.54 | 0.29 |
 | 0.20 | 0.70 | 0.30 | 0.50 | 0.40 |
| 0.10 | 0.50 | 0.13 | 0.50 | 0.40 | |
| 0.10 | 0.60 | 0.60 | 0.60 | 0.50 |
 | 0.30 | 1.06 | 0.51 | 0.69 | 0.90 |
Avg. spreads are taken from each broker's website and updated monthly. Last update on 1 July 2026
We create lists based on this data such as the Australian Lowest Spread Forex Brokers or UK Lowest Spread Forex Brokers page.
Testing Actual Raw Account Spreads
Again, we use the spread monitor across the six major currency pairs to conduct our testing for Raw Accounts. Spreads for Raw Accounts are typically lower than those for Standard Accounts. Often, spreads for these accounts are Zero Spread Accounts, justifying the “Zero” in some brokers’ account branding.
How We Calculate Spread Costs (in USD)
This table shows the calculations we use to compare spread costs across the currency pairs. A standard USD spread cost allows us to compare spreads across brokers and currency pairs.
| CurrencyPair | Close | Unit Size (1 lot) | Pip Size | Spread | Value of a Pip (USD) | Spread Cost (USD) |
|---|---|---|---|---|---|---|
| AUDUSD | 0.669 | $100,000 | 0.0001 | 0.82 | $10.00 | $ 8.21 |
| EURUSD | 1.061 | $100,000 | 0.0001 | 0.73 | $10.00 | $ 7.31 |
| GBPUSD | 1.208 | $100,000 | 0.0001 | 1.15 | $10.00 | $11.52 |
| USDCAD | 1.374 | $100,000 | 0.0001 | 1.00 | $7.28 | $ 7.26 |
| USDCHF | 0.924 | $100,000 | 0.0001 | 1.40 | $10.82 | $ 15.15 |
| USDJPY | 132.897 | $100,000 | 0.0100 | 1.09 | $7.52 | $ 8.21 |
Spreads are always stated in pips in forex trading, a pip being 1/10,000th (0.0001) of a standard “lot”. A “lot” is 100,000, so a pip in the case of an AUDUSD trade is USD $10 (0.0001 x 100,000).
If the average spread for AUDUSD is 0.821 pips (for example), the cost of the spread is USD $8.21 (0.821 x $10). This method of calculation is used in the same way to give USD spread costs for EURUSD and GBPUSD spreads.
To calculate USD spread costs For USDCAD and USDCHF spreads, it’s a little more complicated. Pips are always stated in terms of the quote currency or the second currency in the pair. So, USDCAD pips are in CAD and USDCHF pips are in CHF.
To convert CAD and CHF to hourly USD spread costs, we use the hourly close prices of the USDCAD and USDCHF, respectively. For example, if USDCAD had a closing price of 1.374, the value of a pip is USD $7.27 (10 / 1.374).
Finally, to calculate USD spread costs for USDJPY, we use the same method as for USDCAD and USDCHF, with the exception that a pip is 1/100th (0.001) instead of 1/10,000th.
How We Compare Broker Commissions
For Raw Accounts, we compare Commission Rates by collating the commission rates published on broker’s websites. We then test that the published Commission Rates are correctly applied by opening and closing small trades in each of the six major currency pairs.
Brokers publish their commission rates in the base currency of your account. The commission is calculated per lot (100,000). If your broker’s website shows a 7.00 commission and your account is based in AUD, your commission is AUD 7.00 per lot.
Brokers publish Commission Rates either on a “per side” or on a “round trip” basis (per lot).
- “Per side” means a commission for each of the open and close transactions for a trade. For example, if the commission is $2.50 per side, $2.50 is charged for the opening of the trade and again for the closing of the trade, giving a $5.00 total commission. Note that the entire -$5.00 will show as the commission (in your MT4 window) when you open the trade.
- “Round trip” means a commission for both open and close together. It is the total commission for the trade. For example, if the commission is $5.00 round trip, -$5.00 will show as the commission in your MT4 window.
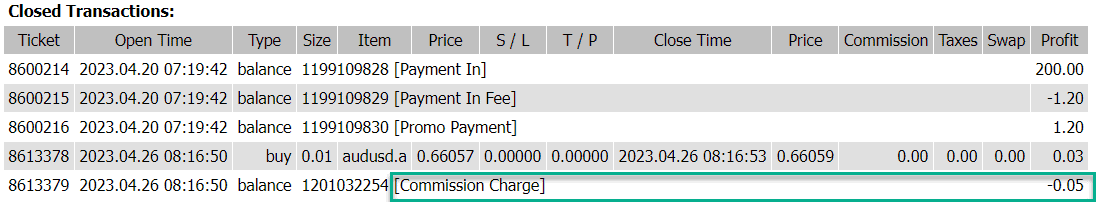
The following example is a report from an MT4 terminal’s Account History, showing an open trade of 0.01 lots with a commission of -$.05 (-$5.00 x 0.01). This could have been from either a $2.50 “per side” commission or a $5.00 “round trip” commission (per lot).

Some brokers charge commissions as a percentage of the transaction size rather than quoting a fixed commission per lot.
For example, CMC Markets charges 0.0025% per side. This equates to a total commission of $5 per lot (100,000 x 0.0025 / 100 x 2). Unlike other brokers, CMC markets also show the commissions as a separate line item in its Account History, as below:
We listed the best in this category on the Lowest Commission Brokers page and found in our Fusion Markets Review that the broker has the lowest commissions.
How We Calculate Total Trade Costs for Raw Accounts
For Raw Accounts, the total trade cost is the sum of
- The Spread Cost
- The Commission
We standardise spread costs across currency pairs by calculating a USD cost. However, commissions are charged in the base currency of the trading account. Our site, therefore, converts all trade costs to a single currency for comparison purposes.
Our Free Forex Fee Calculator
To help traders calculate and compare the costs of individual trades we create the forex fee calculator (the first of it’s kind). This combines the average published monthly spreads with the commission rates of each broker. Of course, the commission rate is dependent on the base currency a trader selects when opening an account and this is factored into the calculator. The spread is also dependent on the currency which again is factored into the calculator. The only other factor is the forex cross value which is collected through an API.
Simply select your preferred base currency and then the currency pair and volume you want to trade to learn the forex fees by broker.
Calculate Your Trading Costs Below
Total Fees

Commission
Spread Costs
Total
Total Fees

Commission
Spread Costs
Total
Total Fees

Commission
Spread Costs
Total
Total Fees

Commission
Spread Costs
Total
Total Fees

Commission
Spread Costs
Total
Total Fees

Commission
Spread Costs
Total
Key Takeaways
- We compare the trading costs for both Standard (no commissions, variable spread) and Raw (fixed commissions, lower variable spread) Accounts both by collating data from broker’s websites and by monitoring spreads using the MT4 indicator.
- We open live, funded accounts with each broker to test spreads and confirm the brokers’ published commissions.
- We calculate the total trade cost for Raw Accounts as spread plus commission.
- We present total spread costs either in the chosen base currency of the user or in USD as the default.


Ask an Expert